The Story So Far
As the year began, forecast models were already toying with the idea of a large warming of the central and eastern tropical Pacific during spring-autumn 2026, making for an El Niño event somewhere within the moderate to very strong range. Confidence was not great however, with the NOAA Climate Prediction Center in January giving a 35% chance of an at least weak El Niño having begun as of May-July 2026.
Confidence is typically inhibited early in the year due to what’s known as the ‘spring predictability barrier’, which refers to February-April being a time of year when certain relatively small-scale events are required for an El Niño event to kick off. Such small-scale features are inherently difficult to predict more than a fortnight or so in advance, and many long-range models are overly keen to predict that they will happen, which has led to numerous ‘cry wolf’ situations over the years; predicted El Niño events that never transpired.
Through spring, confidence improved, as an increasing number of required features manifested. NOAA CPC’s May-July El Niño probability was just over 60% as of May. It then rocketed to about 98% in June. Meanwhile, it was becoming increasingly clear that this event could become among the strongest on record, with the probability of a very strong event at just over 60%. This increased further to 75% in July.
This has been partly in response to observed conditions, with the May-July relative Oceanic Niño Index (RONI) comparable to that of the strongest El Niño events of 1950-2025.
I’ve included 2023 in the table to demonstrate that while it was a very strong event when using the standard Oceanic Niño index, it fell considerably short when using the RONI. Typically, a strong El Niño event forces cooling of the mid-latitude oceans via increased westerly winds overhead, but this was not seen in 2023.
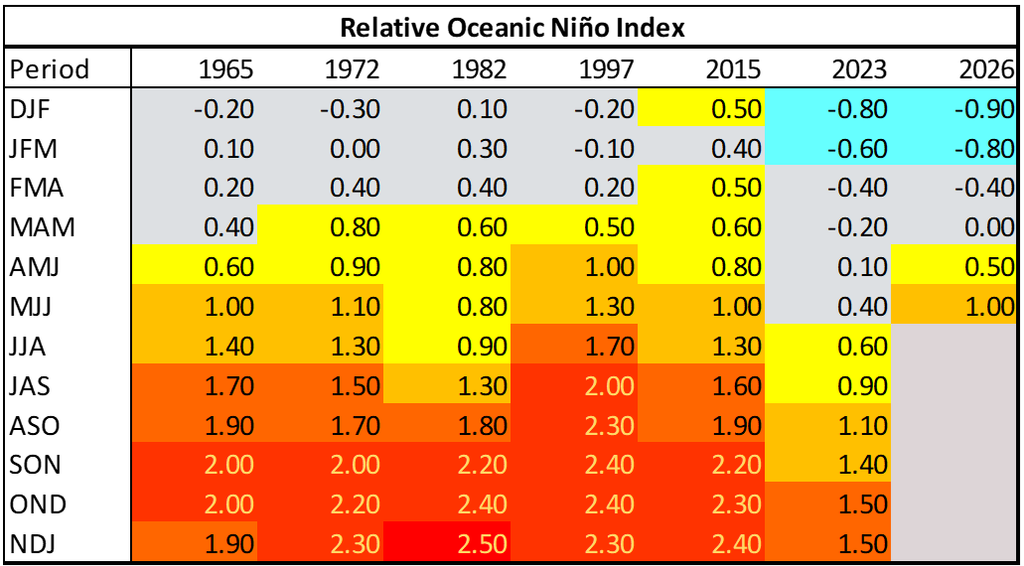
If we overlook 2023, it becomes clear that 2026 has its own unusual trait: Starting off with a La Niña present (RONI -0.5 or lower). None of the other very strong El Niño years since 1950 started out with an RONI lower than -0.3, yet 2026 began with -0.9.
This makes 2026’s subsequent warming even more impressive, along with the current forecasts:
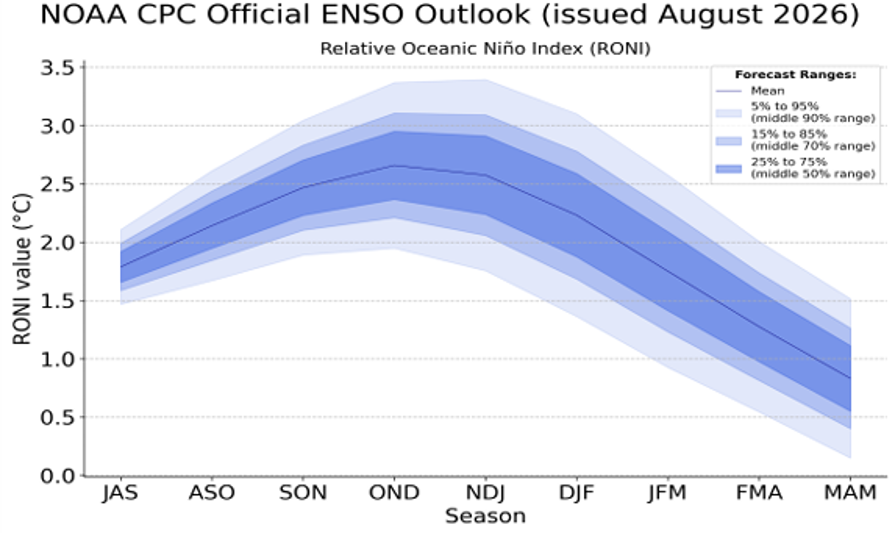
Official outlook from the National Oceanic and Atmospheric Administration Climate Prediction Centre.
This from the NOAA CPC features a mean forecast that exceeds the 1950-2025 record-highest RONI of 2.5, held by Nov-Dec 1982 and Dec-Jan 1983. Only 5% of scenarios fall short of a very strong event (at least 2.0), while the interquartile range spans from 2.3 (among the strongest on record) to almost 3.0 (strongest since at least 1887).
There’s a very real prospect that this event becomes stronger than any in history that we have reliable data for. This raises a crucial question: Can we use lesser events to provide useful guidance on how a potentially record-shattering event will affect weather patterns this autumn and winter?
A Sense of Scale
To get a sense of how linear or not the effect of increased El Niño strength is, let’s look at boreal winter (Dec-Feb) temperature signals in the USA, Canada, and Europe.
El Niño’s effect on global mean temperatures is sometimes misinterpreted as ‘makes it warmer everywhere’. To help make clear how untrue that stance is, the view here is with respect to notably high temperatures. Each map shows what proportion of historical months meeting the El Niño strength criteria saw a mean temperature in the highest third (upper tercile) of historical records.
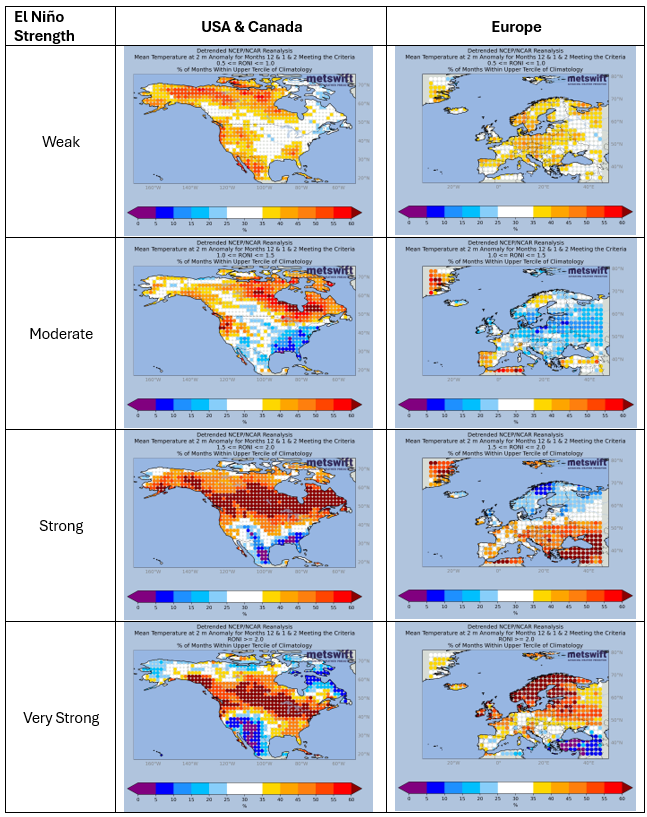
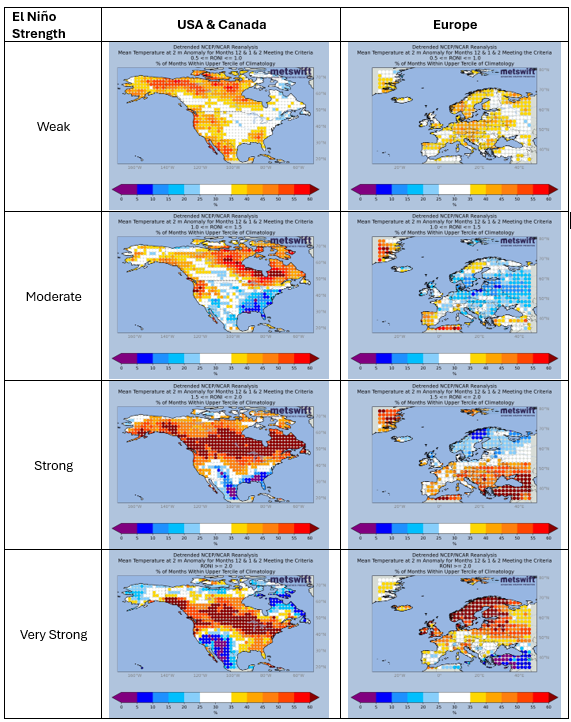
So, what do we see? Starting with the top two maps, a considerable inconsistency jumps out. The typical response to weak and moderate strength El Niño events differs for all but central-northern Canada, the north-western US, and a few small areas of Europe.
Notice too the sizable areas with a very low signal for notably warm conditions. No doubt here that El Niño doesn’t drive warmer weather everywhere at once.
When we shift our gaze to the strong category, the picture becomes more dramatic. This is partly because the number of qualifying months reduces to 15 (with 5 in each calendar month), but that’s still a large enough sample size to draw meaningful deductions from.
Notable warmth is well signalled for a wide swathe of Canada and parts of Alaska, along with south-eastern Europe. Meanwhile, it’s strongly unfavoured for parts of the southern US, neighbouring Mexico, and central-northern Scandinavia.
This is broadly consistent with the signal from moderate strength events for the USA and Canada, but not Europe. So, in North America the effect appears to scale upward linearly in tandem with El Niño, but in Europe it seems to move between distinct response patterns.
This narrative continues when looking at the very strongest El Niño events, for which there are 13 qualifying months. The general location of signals for and against notable warmth changes little in the USA and Canada, but massively in Europe.
Strong Signal for North America but northern Pacific Compels Caution
The above analysis leads to a confident statement that the very strong El Niño event will encourage a notably warm winter for much of southern Canada and the northern US. Also, a notably cool one for parts of the southern US and neighbouring Mexico.
I stress ‘encourage’ because while mighty, El Niño isn’t the only high-impact player on the field. There’s a pattern of sea surface temperatures in the non-tropical northern Pacific known as the Pacific Decadal Oscillation which should not be overlooked. Historically, this oscillation has almost always been in a positive phase during the development of strong or very strong El Niño events, but this year it’s remained stubbornly in a negative phase. If it says that way through winter while El Niño becomes very strong, we’ll be in almost uncharted territory, with December 1991 the only month since 1950 to have such a combination.
That December was notably cool in far northern and eastern Canada along with the central US, but a single instance is not a reliable basis for future expectations.
Inconclusive for Europe
For Europe, the clear pattern shifts with increasing strength of El Niño raise the possibility that if the 2026-27 El Niño proves as record-shattering as forecasts suggest, it could produce a different response to what was typical of events in the 2.0 to 2.5 range.
What’s more, the Pacific Decadal Oscillation is known to have some influence on European weather patterns. If that remains stubbornly negative, the true role of the Pacific in Europe’s coming winter will be practically unknowable.
Fortunately, there are other significant sources of predictability for Europe that lie closer-by, such as the North Atlantic sea temperature pattern. MetSwift’s Claros model leverages these to provide a forecast with a confidence level that better withstands the Pacific heading into uncharted territory.
The Bottom Line: Be Wary of Confident Forecasts
The existence of a very rare Pacific Decadal Oscillation – El Niño combination alongside the latter looking likely to reach extreme, perhaps record-breaking strength will push seasonal forecast modelling – both traditional an AI-involved – to its limits.
In my view, this gives cause to view their predictions as being more uncertain than their respective confidence measures suggest. One thing an ensemble approach can’t account for is model bias; an entire suite can be erroneously skewed toward a certain outcome.
What we can say with good confidence is that there will be noteworthy regional-scale anomalies within weather patterns at timescales ranging from daily to seasonal, as a high-end El Niño dramatically alters the distribution of equator-pole energy transfers.
This is a time for vigilance as we witness the unfolding of what could well be a once-in-a-lifetime El Niño.