For much of autumn 2026 there has been a dominant narrative circulating regarding December 2026 in Europe. It speaks of a generally mild, wet, windstorm-prone month for the north, drier and calmer in the south.
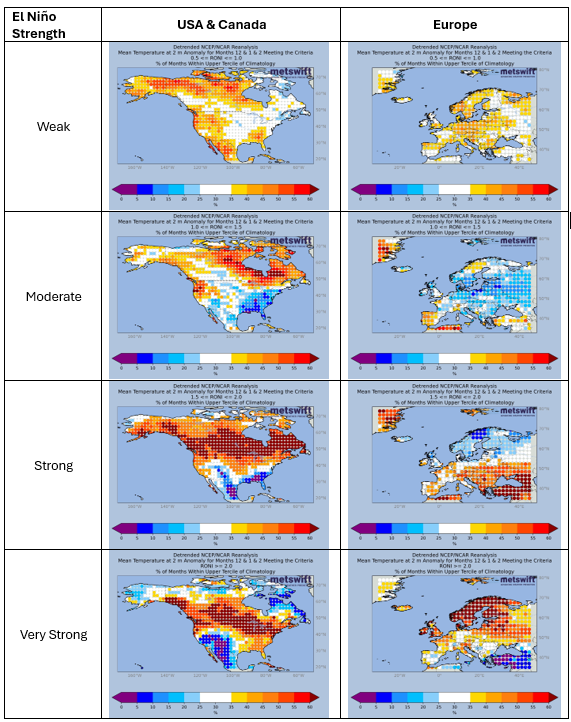
This also loosely describes how European Decembers have tended to behave during very strong El Niño events. One such event is ongoing at the time of writing (Nov 2026) and expected to continue through December. It’s unlikely that this is a coincidence.
The influence of El Niño events on Europe’s Decembers (and winters overall) is generally tenuous, but very strong events do have an effect capable of withstanding some interference from other influential phenomena, such as patterns of sea surface temperature anomalies in the North Atlantic.
El Niño is also one of the most predictable phenomena when looking at winter from a start point in autumn. This means it tends to have a dominant influence on the signals produced by ensemble models that predict weather patterns at long lead times.
For this blog we’ll focus on the seasonal models, which predict 1 or more months ahead. They update once per month and have exhibited some rather interesting behaviour this autumn…
A Late Shift in Seasonal Model Signals
These days, there are many seasonal models in operation, with 9 of them well-established. Thankfully, Copernicus provide a combined view of these models, otherwise this would be a very long section of the blog!
The maps below show ensemble mean predictions for the mean sea-level pressure anomaly (SLPA; departure from long-term average) in December 2026 across Europe. While summarising these, I’ll also refer to temperature and rainfall anomaly patterns which I’m viewing ‘behind the scenes’, along with implications for snowfall, which are based on my experience as a Meteorologist.
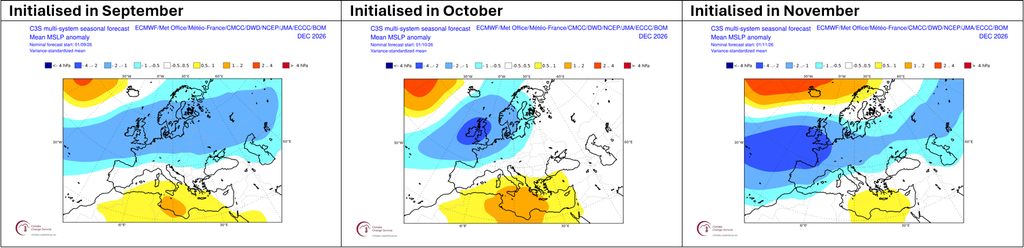
The September initialisation painted a very unsettled picture for northern Europe. The swathe of blues on the map indicates more low pressure systems than usual crossing right over north-western Europe. The result, widely above normal rainfall and temperatures in the northern half of Europe, with snowfall below average except perhaps on high ground in Scotland and Scandinavia.
October saw the seasonal models double down on that signal for north-western Europe, while easing it slightly for north-eastern Europe. Not much change to the associated rainfall, temperature and snowfall signals.
The freshly released November initialisation features some significant changes. The suggested typical path of Atlantic low pressure systems is further south. It’s now well south of where it would usually be, which is close to Iceland (hence the positive SLPA there; yellow to red shading). The signal for a wetter than usual month has followed suit, focusing across south-western Europe. The models still predict widely above normal temperatures, but the signal has become weak for northern Europe. These latest predictions suggest more in the way of cold air incursions across that region, with snowfall close to average, perhaps a bit above for areas at around 200 m or greater elevation. Further south, the implied picture is still generally below average, but perhaps near normal in the Alps.
Why The Shift?
Put shortly, as we’ve drawn closer to December, it’s become increasingly clear that factors outside of El Niño will be interfering a great deal.
If you’re interested in a more detailed explanation, have a read of the next two sections.
Stratospheric Signal
One of those factors is called a major sudden stratospheric warming (SSW) event. This is defined as a reversal of the zonal mean zonal wind at the 10 hPa air pressure level (i.e. in the upper stratosphere, about 32 km altitude) at 60 degrees north (60N, which is e.g. a little north of the UK but south of Iceland). More intuitively, this refers to a reversal of the typical circulation of air high up in the atmosphere above the northern polar region.
This event was first signalled by forecast models in late October but only as a small possibility. It then gradually increased in likelihood until, about a week into November, it began to look certain. The graph below shows that the circulation reversed during 11th-13th November 2026.
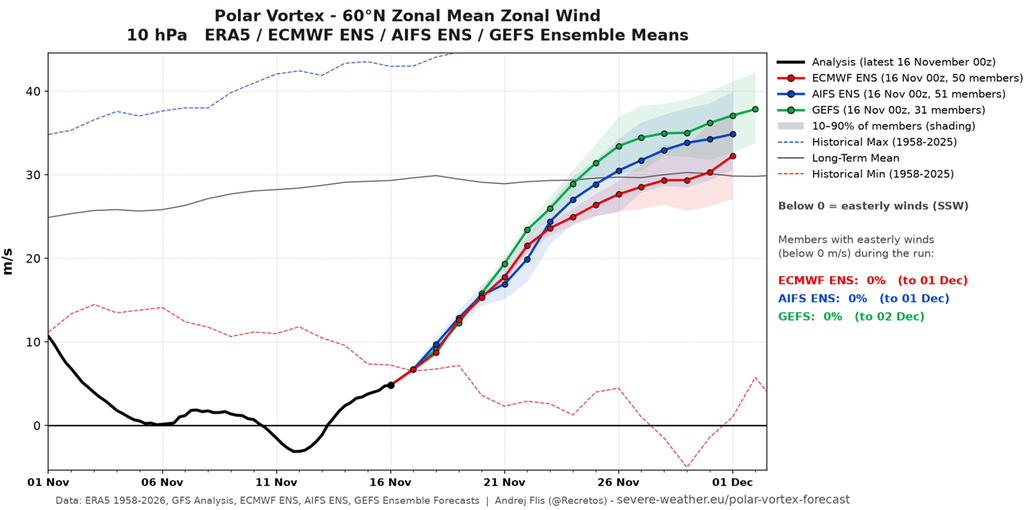
It’s worth taking note of the dashed red line on that graph. It shows the lowest zonal mean zonal wind recorded on each date within 1958-2025. The period 5th-14th November will be at times as far below the record as that record is below the long-term average (thin solid black line). Truly we are in uncharted territory, with this major SSW the earliest on record by over a fortnight.
What’s more, during past very strong El Niño events, the zonal mean zonal wind has tended to be above average. This corresponds to a strong polar vortex – a cyclonic (anticlockwise) circulation in the polar stratosphere. A strong polar vortex usually drives mild, wet, and windstorm-prone winter weather across northern Europe. This connection is likely a major reason for the seasonal models predicting what they did in early to mid-autumn.
The relevance of that connection to December 2026 is now under question. While forecasts suggest the 60N zonal mean zonal wind at around 32 km altitude will head toward its usual state during the second half of November, it’s a different story lower in the stratosphere.
A Layered Story
The plot below shows zonal mean zonal wind for a vertical cross-section of the atmosphere (y-axis) and how it evolves over time (x-axis) in the latest ECMWF control model forecast.
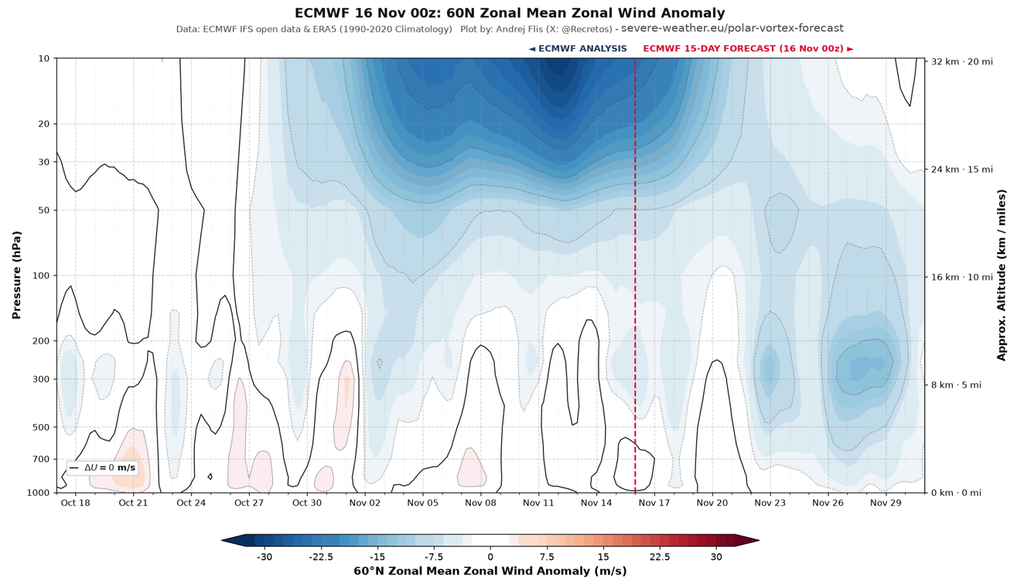
Notice how the anomalously negative zonal mean zonal winds (blue shading) seem to shift downward for late November. This appears to be an instance of major SSW-driven anomalies descending toward the troposphere (layer of atmosphere we live in) to influence surface weather patterns. However, I don’t think that’s the whole story. Events occurring within the troposphere could well be lending a hand, as detailed next.
A Tropical Tale
Areas of strong thunderstorm activity near to the equator sometimes organise into a large-scale structure. A kind of along-equator wave in the atmosphere in which one part sees many thunderstorms and the other few. The coming and going of this structure is known as the Madden-Julian Oscillation (MJO). One way to represent it is using an RMM plot, as shown below.
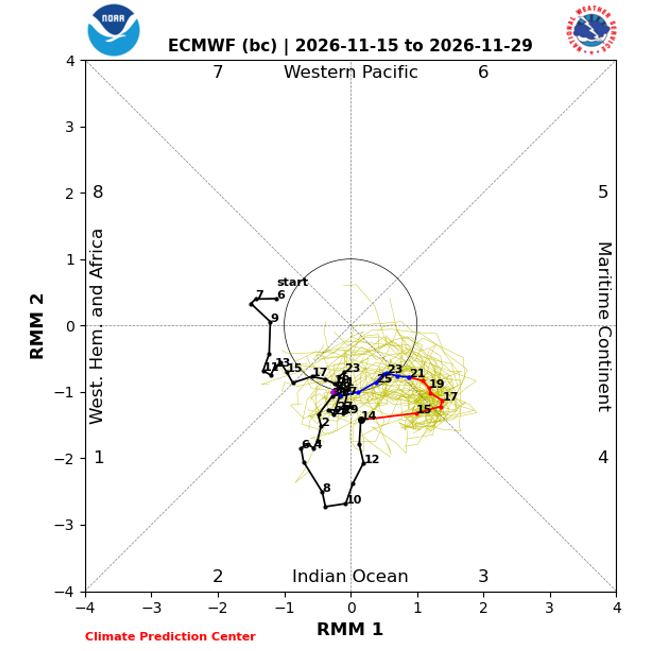
By this approach, the MJO is ‘active’ when the values of RMM 1 and RMM 2 place a point outside of the central circle. The black line connects observed points going back to 2nd October 2026. During that time, the MJO has nearly always been active, especially since 2nd November. It’s forecast to remain so for about another week.
Importantly regarding Europe this December, an active MJO transfers a lot of energy into the upper troposphere, which then travels poleward during the following 1-3 weeks (in a complex manner that I’ll spare you the details of here). This has a substantial effect on mid-latitude weather patterns. In some cases, this in turn affects patterns across the polar regions, with the zonal mean zonal wind there becoming more negative than usual. Importantly, when the polar vortex is in a weakened state higher up, this effect can extend into the lower stratosphere.
Signs are, we may see one of those cases in late November. What’s more, the El Niño will help, as it supports more widespread strong tropical thunderstorm activity than usual along the equatorial Pacific (additional poleward energy transfer). So, we potentially have El Niño-assisted MJO forcing helping the major-SSW driven circulation anomalies to reach toward the troposphere.
Implications for Europe’s December Weather
A more negative than usual zonal mean zonal wind in the troposphere at 60N broadly corresponds to a south-shifted typical path of low pressure systems moving off the North Atlantic. Sounds familiar, doesn’t it?
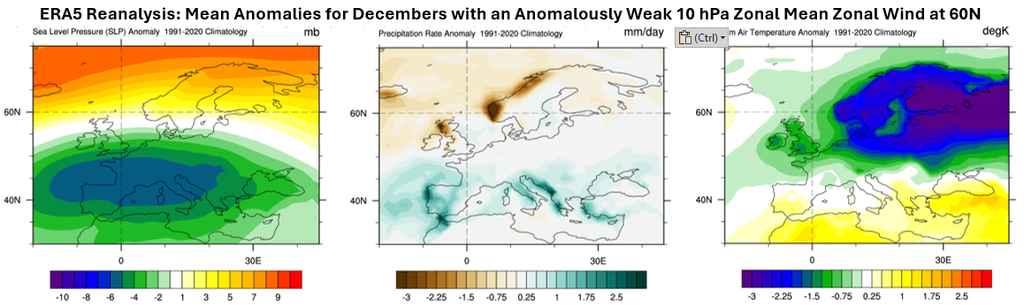
Please note that these maps don’t use detrended data; to account for that the temperature one should be adjusted upward by ~1°C.
If there was a typical or stronger than usual polar vortex present in the lower to mid-stratosphere, this shift would only be expected to last for about a week. With that not being the case in current forecasts, it’s feasible that it could last a week or two longer.
Back when the November seasonal model runs were initialised, this combination was only a suggestion in the nearer-term forecast. So it’s very interesting that they shifted their predictions closer to what this MJO-SSW combined forcing might lead to.
It seems likely that at least some southward shift to the typical path of low pressure systems will feature in December 2026. Unfortunately, the key detail of just how far southward and for how long are highly uncertain at this time.
What we can say is that the focus of wet and windy weather looks likely to be further south than was being signalled by seasonal forecast modelling back in October. Meanwhile, the risk of cold spells with winter weather hazards is higher in the northern half of Europe. Plenty to keep an eye on then! As usual, I’ll frequently be posting updates on social media (@peacockreports).
James Peacock MSc
Head Meteorologist at MetSwift
Featured photo by BEN ELLIOTT on Unsplash