Having been subjected to sharp price hikes raising price caps to alarming levels, Europe’s eyes are turning to the upcoming cold season with a sense of trepidation. Prolonged cold weather has generally become scarcer in recent decades, but we know from the likes of mid-late Feb 2018 that such conditions are far from extinct. It can even be predominantly freezing for an entire month, as Dec 2010 made clear, though that was an extreme example.
This blog takes a first look ahead at the upcoming cold(er) season (Nov-Mar), purely from a temperatures perspective but via a measure which relates those to our heating bills.
Heating Degree Days (HDDs)
Degree days are based on how observed or predicted temperatures compare to a baseline figure. For a given time interval, nonzero HDDs are associated with temperatures that below the baseline. A larger difference means more HDDs. If the temperature is equal to or above the baseline, there are zero HDDs for that interval.
The HDD baseline is the minimum building-averaged temperature for ‘comfortable living’. It varies depending on where you are in the world, but for most of Europe it’s 15.5°C, which is used for the analysis in this blog.
Summing HDDs across multiple hours, days, months, etc. gives us cumulative HDDs (CHDDs). Broadly speaking, the higher the CHDDs, the greater the total energy requirement for keeping buildings at comfortable temperatures.
Due to variations in HDD calculation method and ever-changing energy costs, we can’t use CHDDs to calculate heating bills, but we can make comparisons between predictions and ‘normal’ conditions to gauge the likelihood that CHDDs, hence heating bills, will be higher or lower than usual.
Heightened Risk of a Cold Start to 2023 in Western Europe
The plot below shows how the probabilities of notably high or low monthly CHDDs compare between the 21st Century so far and MetSwift’s Advanced Statistical model. This model considers selected ‘analogue’ years, which are chosen based on the recent and expected future behaviour of large-scale phenomena that are known to drive weather patterns.

The following summaries are all relative to the observed frequency so far this century (e.g. ‘increased chance’ means more likely than using all years 2000-2021 would suggest). From this point forward, ‘normal’ will refer to the 21st Century so far as opposed to the more usual 1991-2020 baseline.
For Northwest Europe, the Advanced Stat chance of CHDDs being in the upper quartile (indicating a notably cold month) is slightly reduced for Nov-Jan but increased for Feb-Mar. Meanwhile, the chance of a particularly mild month (CHDDs in lower quartile) is much reduced for Nov and slightly increased for Mar. It should be noted that the % chance of a notably cold month is never more than 25%; far from ‘likely’.
For Northeast Europe, the Advanced Stat chance of a notably cold month is raised for Nov but otherwise changed little. Again, it’s never higher than 25%. There is suggested to be a good chance of particularly mild months Nov-Dec, before the chance reduces strongly for Jan-Mar.
For Southeast Europe, the chance of a particularly mild month is reduced for all of Nov-Mar. Yet the probability of a notably cold month is appreciably raised for Nov only, while it’s reduced to negligible for Jan-Feb. Overall, a near normal colder season is suggested for this region.
For Southwest Europe, we see the strongest suggestion of a notably cold season. The Advanced Stat chance of CHDDs in the upper quartile is much increased for all of Nov-Jan along with Mar, peaking at 60% for Jan. Yet the probability of a particularly mild month is only reduced in Dec-Jan, and is much increased for Feb. This suggests a ‘short but sharp’ colder season is considerably more likely than normal.
Tall North Atlantic Ridges
I believe the indications of notably colder than normal weather for most areas in Nov, then Southwest Europe in Dec, have much to do with the behaviour of a weather system known as the Azores High. Specifically, how that tends to change when there is a well-established La Niña event (negative state of the El Niño Southern Oscillation; ENSO) occurring alongside a widely warmer than usual North Atlantic (which is expected late 2022 into early 2023).
The typical sea-level pressure (MSLP) and temperature anomalies for Nov-Decs fitting that bill are displayed below.

High pressure is present to the west and across the northern half Europe more often during these years – symptomatic of the Azores High shifting northward or north-eastward from its usual position. In tandem, low pressure systems occur more frequently over the western or central Mediterranean. This pattern increases how often cold polar air moves across western and central Europe from the northwest, north, or northeast.
On the face of it, this looks very ominous for raised heating bills in these regions, but there’s an important catch: There are only four matching Nov-Decs and while three saw this cold pattern (1962, 1995, and 2008), the other was very mild (2011). That implies an unreliable response, so we can say that a colder than usual Nov-Dec in south-western and central Europe is more likely than usual, but far from guaranteed. For Northwest Europe, a warming North Atlantic has increasingly subdued the chilling effect of such weather patterns. This makes a notably cold outcome is less likely, but it still has a 14-17% chance, so can’t be ruled out.
In eastern Europe, I can see a decent chance of CHDDs being near or below normal, especially in the northeast. Of course, this really means ‘less cold’ in the northeast, but as the saying goes, every little helps.
Late Winter into Spring – Different Ballgame?
The concurrence of La Niña with a warm North Atlantic also provides some explanation for the Advanced Statistical model’s widely above normal probability of notably cold conditions in Feb-Mar. Matching historical years have tended to feature a ‘high-latitude blocking’ pattern that brings unusually cold weather to all but the far Southeast of Europe.

Yet if you were to read up on literature surrounding La Niña events in general, you would find many studies concluding that it encourages mild conditions to establish across northern Europe by Feb or even Jan. A considerable contradiction!
I believe this has much to do with what’s tended to occur in the stratosphere (the layer of Earth’s atmosphere above the one we live in) when ENSO and a couple of other key driving forces have been in similar states to what’s expected this winter.
Unsettling Stratospheric Signal
Using a list of identified major sudden stratospheric warming (SSW) events spanning 1959-2019, we can look at how the frequency of those events compares between all historical winters and those that occurred during a La Niña event that varied between weak and strong intensity.
The results are startling, with split type SSWs occurring 22.2% more often in the La Niña winters, while displacement ones occur 12% less often.

The increased overall SSW frequency (by 10.2%) is consistent with the findings of Garfinkel et al (Oct 2012), in which a similar increase was also observed for La Niña’s counterpart, El Niño. However, the preference for split types observed here is much stronger. That they analysed winters up to 2003 is likely a factor, as of the 4 La Niña winters of 2004-2019, 2 saw a split type SSW, and none a displacement type. Differences in categorisation method will also be contributing.
Split Type SSWs Hit Europe Hard
The much raised probability of a split type SSW is a big deal for Europe, because it’s this type that’s associated with the most prolonged and intense cold weather outbreaks. As shown on the top row below, it typically leads to predominantly cold conditions for most of the continent. That translates to well below normal temperatures overall, with far above normal CHDDs (most of all in central parts), which imparts an economic strain even in ‘ordinary’ times.

Contrast that with the displacement type (bottom row), for which overall temperatures tend to be mild to very mild widely. Individual cold days occur more often than usual in northwest Europe, but mild spells tend to be more potent, which suggests CHDDs at worst near average. It’s a shame this type looks less likely than usual this winter!
Considering the Solar Cycle and Quasi-Biennial Oscillation
Research (e.g. Richter et al, Oct 2011) has demonstrated that the solar cycle of the sun and a temporal pattern of equatorial stratospheric winds known as the Quasi-Biennial Oscillation (QBO) also significantly influence SSW frequency and type.
This coming winter will occur about halfway between solar minimum and maximum, with a positive QBO state. Filtering the historical La Niña winters for comparable solar activity isolates just 3 historical winters within 1959-2019, of which one featured a split SSW (in Jan 1971), and one a displacement SSW (in Feb 2001). This suggests a raised chance of a SSW but with no preference for subtype, however the small sample size means we can’t be confident in that deduction.
Filtering for a comparable QBO state instead, just two winters fit the bill, but both of them featured a split type SSW (Dec 1984 and Jan 2009). Again, the small sample size limits confidence, but it does appear that the expected QBO state in 2022-23 is not unfavourable for a split type SSW.
Conclusion
MetSwift’s Advanced Statistical model suggests that above normal CHDDs are more likely than usual in each of Nov, Jan, and Feb. The highest single probability is 60% for Southwest Europe in Jan. There is an above normal risk of a prolonged spell of cold weather affecting a large part of Europe sometime Jan-Feb 2023.
Below normal CHDDs are most likely to occur in Northeast Europe in Dec and in Southwest Europe in Feb.
These signals are largely driven by the expected coexistence of an unusually cold central to eastern tropical Pacific (La Niña event) with a widely warmer than normal North Atlantic. This connection is direct in Nov to early Dec, but becomes indirect for Jan-Feb, when it is dependent on the occurrence of a split type sudden stratospheric warming (SSW) event.
Such an event has a well above normal probability this winter but is still far from guaranteed. In fact, even when it does happen, cold weather doesn’t always hit Europe – occasionally it hits western Asia instead. A recent tweet by Dr Simon Lee clearly depicts high variability of resulting weather patterns across the past 22 SSW events.
This uncertainty is reflected in the Advanced Stat chances of notably cold months mostly staying below 1 in 3.
We can’t rest easy and it would be foolhardy to ignore the signals at hand, but at this time there’s no reason to expect a notably cold Nov-Mar. Just be prepared for it in case heating demands do prove to be abnormally high. As the popular saying goes, “hope for the best, be prepared for the worst”.
James Peacock MSc
Head Meteorologist at MetSwift
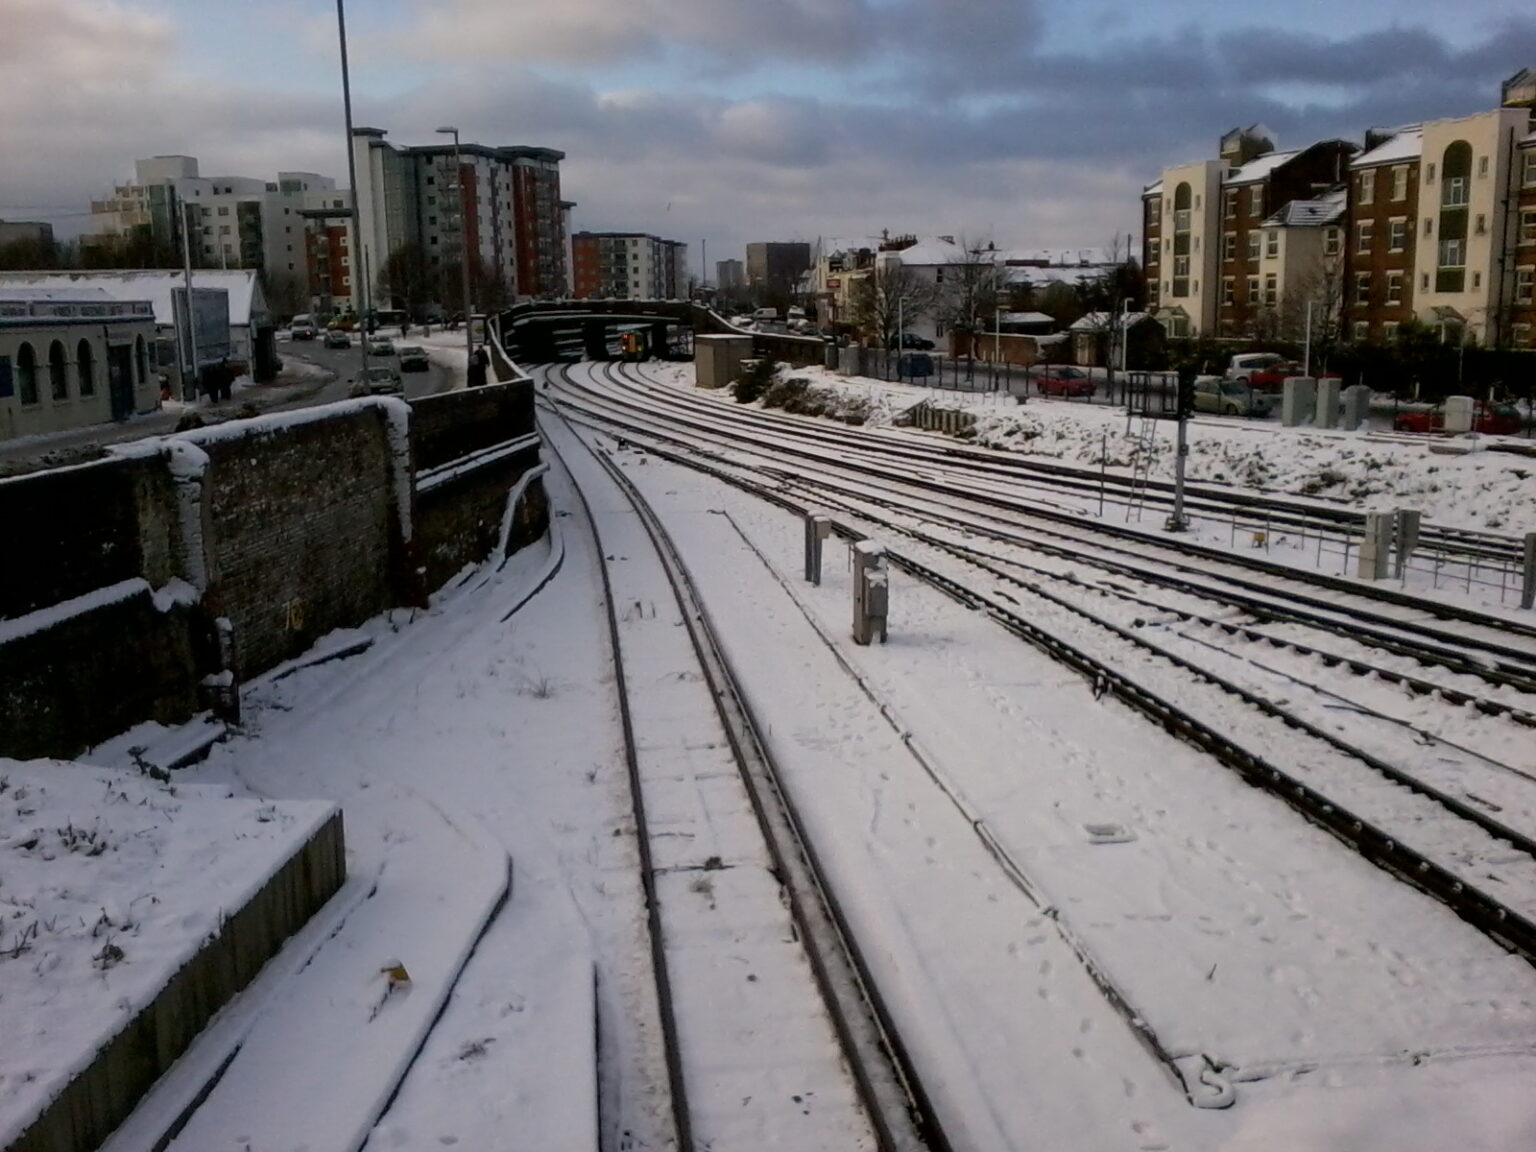
Fun fact: The featured photo was taken by James at Fratton Station, Portsmouth, during the UK’s coldest December in 100 years (2010).