As of late April 2026, MetSwift anticipates that an at least moderate El Niño event will manifest during the second half of 2026. Nearly all other institutions and models agree, with several predicting a strong or very strong (a.k.a. ‘super’) El Niño by October.
This blog looks at the development processes of El Niño and La Niña events, how they are monitored, then how it’s likely to affect weather conditions in many parts of the world June 2026 through to early 2027.
Development Process
El Niño and La Niña events represent two states within an ocean-atmosphere cycle known as the El Niño Southern Oscillation (ENSO). It involves changes to a circulation along the equatorial Pacific called the Walker cell and how those affect the underlying ocean.
The Walker Cell
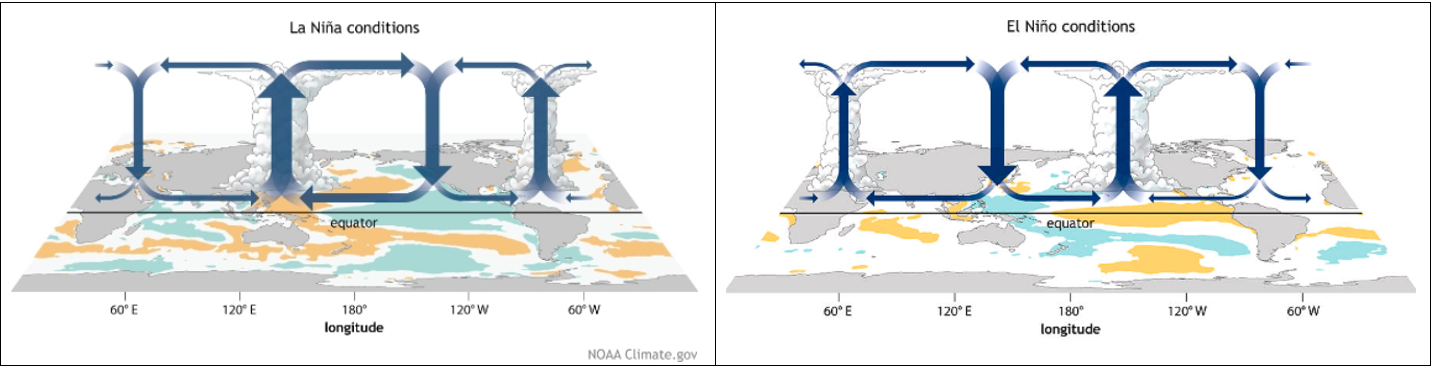
This cell forms part of a wider circulation that regulates wind and rainfall distribution along the equator. When ENSO neutral (neither El Niño nor La Niña occurring), easterlies dominate the near-surface flow along the equatorial Pacific. Meanwhile, westerlies dominate the near-surface flow along the equatorial Indian Ocean. These two flows converge over and around Indonesia, forcing the air upward. With a rich moisture supply from the warm tropical waters, showers and thunderstorms readily form as rising air cools and moisture condenses.
Importantly, that condensation releases energy into the surrounding atmosphere, which then distributes poleward. This is how ENSO events affect global weather patterns.
As illustrated below, a La Niña event supports this default Walker cell behaviour, strengthening it. By contrast, the circulation is weakened or reversed during El Niño events, causing the location of frequent shower and thunderstorm activity to move eastward.
Affect on the Pacific Ocean
Under neutral or La Niña conditions, the near-surface easterlies push the tropical Pacific Ocean westward. Water literally piles up in the western Pacific, with some of it descending and returning eastward at depth. With the import of sun-warmed waters, sea surface temperatures there are often among the highest within any of Earth’s oceans. In contrast, the eastern Pacific receives the water that’s travelled back eastward at depth, beyond the sun’s rays. That water is so chilled that it keeps sea surface temperatures relatively low in the region, despite mainly sunny weather.
An El Niño event depends on this default setup being broken by relatively short timescale weather events. Periodically, enhanced shower and thunderstorm activity propagates eastward along the tropical Pacific. They weaken or temporarily reverse the near-surface easterlies and may also be a catalyst for cyclonic weather systems to spin up either side of the equator, resulting in a stronger reversal. This occurred in dramatic fashion during early to mid-April 2026, with cyclone Maila and super typhoon Sinlaku developing on opposite sides of the equator. In between them, a strong westerly flow occurred along the equator.
By pushing the underlying ocean eastward, these westerly wind bursts (WWBs) cause downwelling of water to occur further east. This leads to anomalously warm waters initially at depth and later at the surface. The strength and frequency of WWBs is the primary factor determining the strength of an El Niño event. As shown below, the exceptional WWB action during April 2026 has resulted in a wide swathe of the equatorial Pacific sub-surface waters becoming least 4°C warmer than usual.
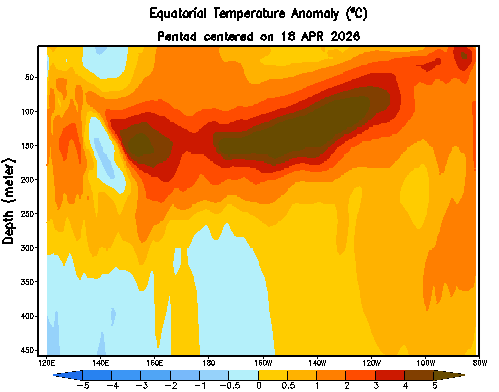
This is about as warm as it ever gets down there. It lends great confidence to forecasts of a strong or very strong El Niño emerging by November 2026.
Monitoring El Niño and La Niña
Broadly, these events are defined based on sea surface temperature anomalies the central and/or eastern tropical Pacific. However, for identifying when an event is occurring and how strong it exists, there exist several routinely used events.
The (Relative) Oceanic Niño Index
The most widely used is simply a mean of sea surface temperature anomalies within a region of the central tropical Pacific known as “Niño 3.4”, illustrated below left. The anomalies are with respect to the full timeseries, which typically reaches back at least 70 years. Usually, these anomalies are ‘standardised’ to produce the Oceanic Niño Index (ONI).
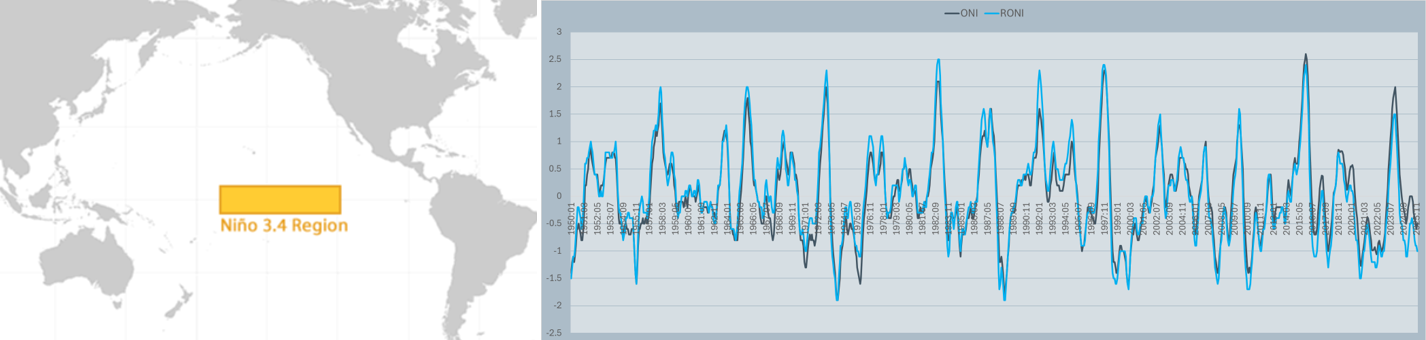
The simplicity of this measure comes with three main drawbacks. Firstly, it says nothing of how the anomalously warm or cool waters are distributed along the tropical Pacific, which can significantly alter how an event affects global weather patterns. Secondly, the long-term warming of the climate has been increasingly skewing it toward higher values. Thirdly, it ignores the atmospheric component of ENSO.
That second drawback can be overcome by either detrending the data or considering how the mean of the Niño 3.4 region compares to the mean of the ocean across the entire tropical belt. The latter has recently been adopted by the National Ocean and Atmospheric Administration (NOAA) for official ENSO monitoring and advisories. The result is known as the Relative Oceanic Niño Index (RONI). In the above right plot, you can see how this compares with the ONI across 1950-2025. Notice how it remains lower than the ONI in more recent years; the climate warming trend is effectively removed.
The Multivariate ENSO Index (MEI)
As alluded to by the name, the MEI considers multiple variables when deducing the timing and strength of ENSO events. Alongside the sea surface temperatures, it considers sea level pressure, wind patterns, and cloudiness within the tropical Pacific.
The main advantage of this compared to the (R)ONI is that it accounts for the atmospheric component to ENSO. This can be important because the tropical Pacific atmosphere can also respond to sea surface temperature anomalies outside the tropical Pacific, plus weather systems which temporarily enhance or dampen the ENSO circulation.
This measure showed its prowess during the 2023-2024 El Niño event. Despite peaking at 1.4 (“moderate”, almost “strong”) according to the RONI and 2.0 (very strong) if going by the ONI, global weather patterns exhibited a response more typical of a weaker event. The MEI peaked at 1.1, which is only just into the “moderate” category (see below).
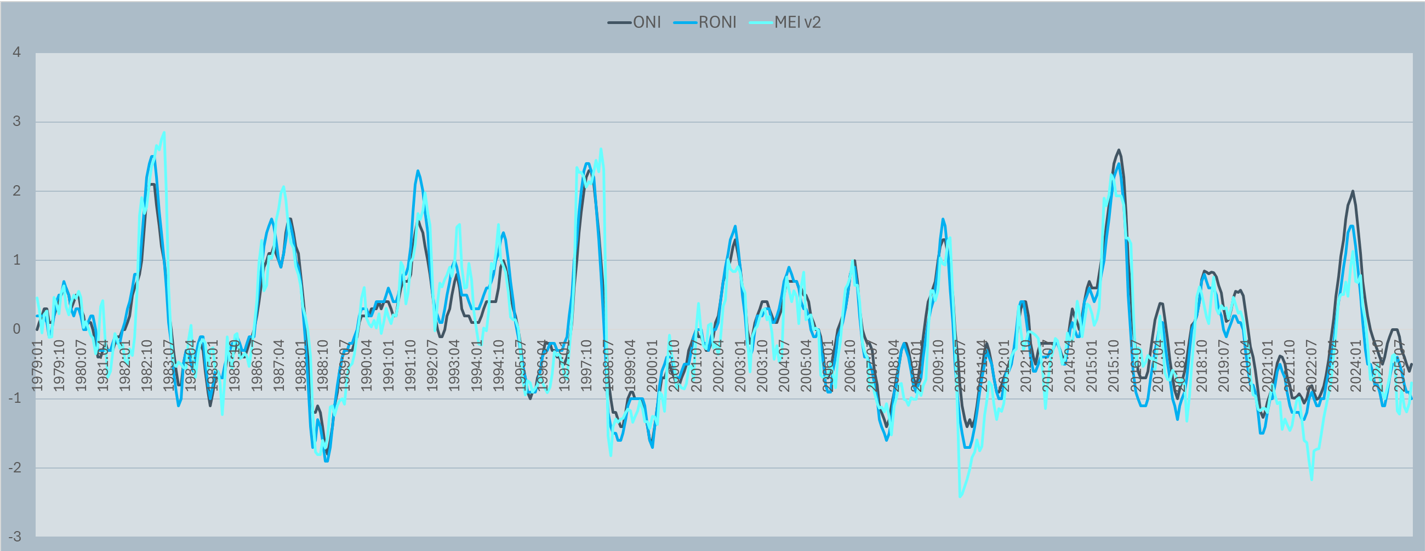
Unfortunately, when it comes to assessing how ENSO events affect weather patterns, the MEI has a drawback. The analysis of cloudiness depends on satellite-derived outgoing longwave radiation (OLR) analysis, for which reliable records begin in 1979. Meanwhile the (R)ONI reliably reaches back to 1950.
Indexes Monitoring the “Skew” of ENSO
There exist at least 7 experimental methods for subdividing El Niño and La Niña events based on how their associated sea surface temperature anomalies are distributed across the tropical Pacific. Unfortunately, no solid consensus has been reached on which method works best. Ideally we would reliably categorise ENSO events by skew, but that remains a work in progress for the scientific community.
Considering all the above, this blog will use the RONI for analysis of ENSO impacts on weather patterns.
How Will El Niño Affect Global Weather Patterns?
Lately I’ve seen some media posts stating something like “we’ll all roast this summer because of the strong El Niño”. This seems to be a misinterpretation of the true statement that a strong El Niño typically raises the global mean temperature for about a year or so.
It’s important to understand that an El Niño event represents an anomalous ocean-atmosphere energy transfer. In moderate or stronger events, the tropical Pacific is so massive that this easily outweighs any opposing fluxes elsewhere – but this takes time. The atmospheric response to an ENSO event tends to peak during the year after the onset of that event.
Another crucial characteristic to comprehend is that this added energy is not evenly distributed across the globe. Reason being, this energy interacts with weather systems to produce regional scale anomalies of cloudiness, rainfall, and wind speed. Wherever that amounts to cloudier, wetter weather, the warming influence of El Niño will be dampened or even outweighed. The contrary also applies: Places that see sunnier, drier weather can experience a strong warming effect.
The same rules apply for La Niña events. The cooling effect may be enhanced, dampened, or outweighed by regional weather changes.
Important: What follows is not a forecast. El Niño is just one of many factors that a good forecast must consider.
A Moderate-Strong El Niño in June to August 2026
Most forecasts predict the RONI will be somewhere in the 0.75 to 1.5 range during boreal summer (austral winter) 2026. This is high for an emerging El Niño event – development usually initiates mid-late spring. Even so, impacts on global weather patterns will likely be limited away from the Pacific in June, becoming more widespread and pronounced toward August.
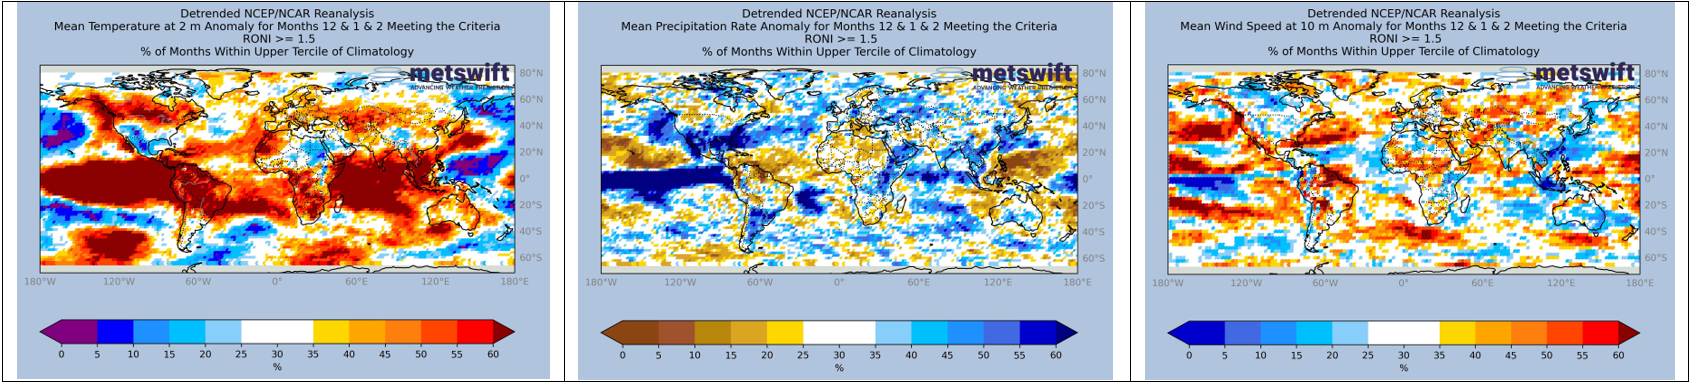
The plots below show the frequency of particularly warm, wet, and windy months for historical Junes, Julys, and Augusts which saw a RONI in the 0.75 to 1.5 range.
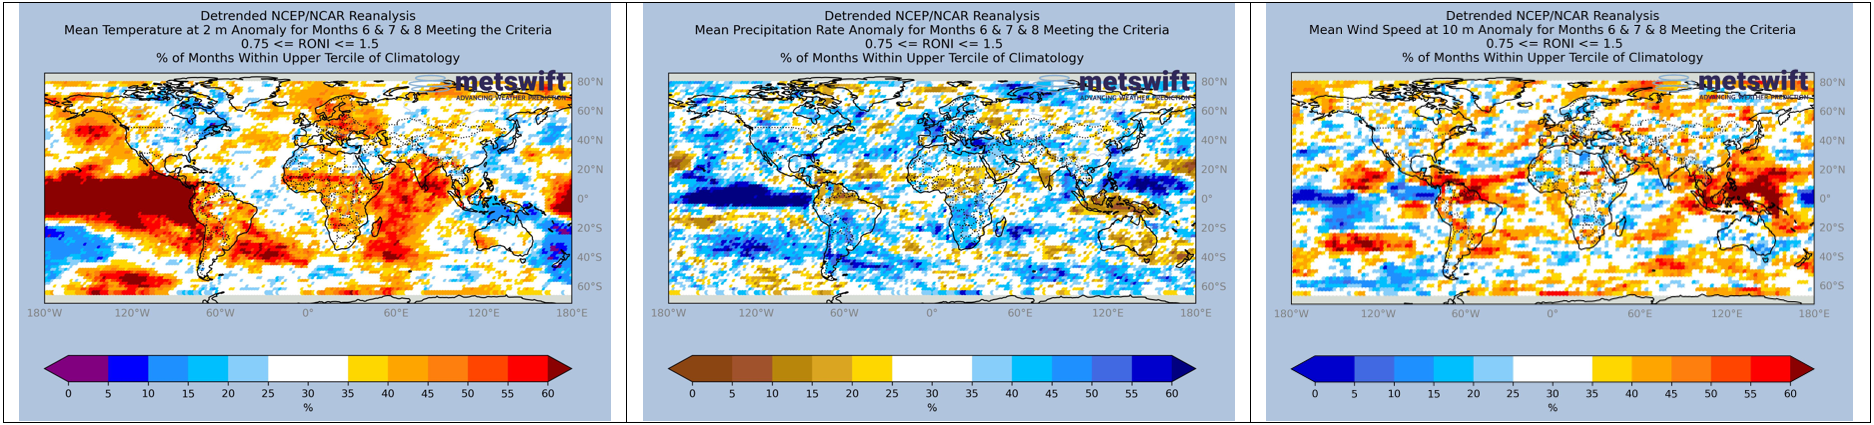
There’s a clear ‘fingerprint’ of El Niño on these maps; a broad swathe of the tropical Pacific where it tends to be particularly warm and wet. A tripole anomaly in wind speed is also evident over the central and eastern Pacific Ocean.
Away from there, the effect is far more complex. An appreciable signal for notably warm conditions exists only in patches, most prominently in the central and western Indian Ocean. That anomaly pattern resembles the positive phase of a phenomenon known as the Indian Ocean Dipole (IOD). This typically occurs in tandem with a moderate or strong El Niño event.
Still, we can interpret a raised risk of anomalously high temperatures in much of South America, the middle belt of Africa, central and eastern Europe, and India. Meanwhile, the risk is reduced in and around Indonesia. A slight reduction is seen for north-eastern North America and Southeast Asia.
The precipitation signal largely follows the temperature one, with the likelihood of notably wet conditions most increased where temperatures are highest, and vice versa. This implies that most of the signal is due to warmer air having higher moisture capacity. The main exceptions are over the central US, southern Argentina, north-western Europe, southern India (monsoon related), and the Philippines. The signal there more likely relates to changes in predominant weather patterns.
The signals for wind speed are mostly weak, but a raised probability of notably windy conditions stands out in the Caribbean and much of Central America, and in the Philippines-Indonesia vicinity.
A Moderate-Very Strong El Niño in September to November 2026
For the boreal autumn and austral spring, RONI forecasts are mainly at least +1.0, with a large proportion above +1.5.
To account for the uncertainty, the plots below relate to a +1.0 to +1.5 range on the top row and a +1.5 to +2.5 range on the bottom row.
They clearly demonstrate that as the strength of an El Niño event increases, the effect on global weather conditions becomes more pronounced, while the pattern of anomalies remains broadly similar. El Niño ‘pushes’ temperatures, precipitation, and wind speed in directions that depend on where you are in the world. Importantly, this is not to say that the weather will shift in that direction every day. Instead there’s an overall shift across many weeks or months.
The response pattern also bears much similarity to that for June-August. I will now focus on where it differs markedly.
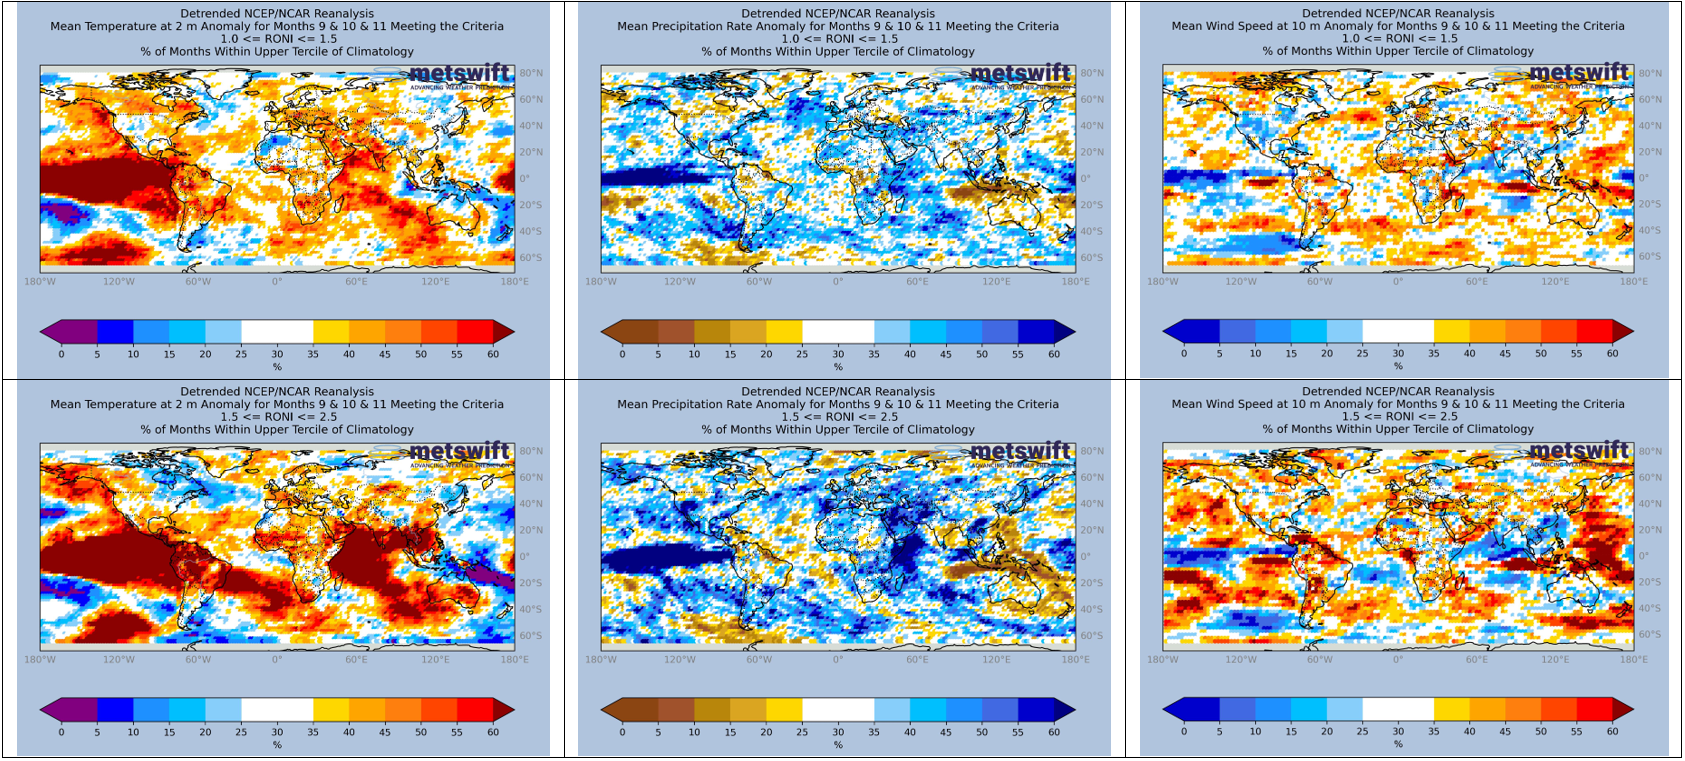
The propensity for notably warm conditions is reduced over eastern Europe but increased over much of Southeast Asia and eastern Australia.
There’s more of a signal for notably wet conditions in the western US, south-western Europe, South Africa, and southern China.
A tendency for notably windy weather now spans much of the Mediterranean. There’s also quite a strong signal for that adjacent to Nigeria and Cameroon.
A Moderate-Very Strong El Niño in December 2026 to February 2027
Again, we see broad similarities to the earlier composites but with some significant regional differences, which I will focus on.
The above normal temperatures signal is increased for the northern half of south America. Evidently El Niño favours a hot summer for Bolivia, Brazil, Paraguay, Uruguay, and northernmost Argentina. This is also true, though not as emphatically, for southern Africa. Meanwhile, parts of Canada have a markedly raised probability of a notably warm (relatively speaking) winter.
Particularly low likelihood of notable warmth is mainly restricted to the oceans, but with striking exception over much of Mexico and the south-western US. In fact, the probability of a lower tercile (cold) winter here (not shown) is widely over 55% in that area.
A considerable probability of a notably wet winter now spans the southernmost US and neighbouring areas of Mexico. Meanwhile the dominant probability shift over India has changed from low to high. The probability has become low over south-eastern Europe.
For upper tercile wind speed, probabilities have broadly increased along a swathe from the central belt of Africa to north-eastern Asia. Japan has flipped from a heightened probability to a lowered one.
Not Working Alone
Overall, it’s clear that strong El Niño events considerably shift the most likely weather conditions in many areas of the globe. The same is also true of La Niña, but I’ll save that for when a moderate or strong one of those is next imminent (probably sometime later 2027 or within 2028).
But it must be borne in mind that there are plenty of other factors that drive weather regimes. For example, even in the Pacific Ocean, there exists a highly influential mode of variation in non-tropical sea surface temperatures known as the Pacific Decadal Oscillation (PDO). It has a positive phase that enhances the effects of an El Niño, and a negative one, which suppresses them. Further afield there are Atlantic sea temperature patterns which can also interact constructively or destructively. They’re a big reason why the effects of ENSO are more muted in Europe compared to the Americas.
This multifaceted interaction of driving forces is considered in full by MetSwift’s ground-breaking Claros model. It intelligently resolves the net effect of this grand scale tug-of-war on likely weather patterns in all regions of the world. Visit our website to find out more and how MetSwift can help you plan and adapt for weather events and anomalies many months, even years in advance.
James Peacock MSc
Head Meteorologist at MetSwift
Featured photo by Joe Caione on Unsplash