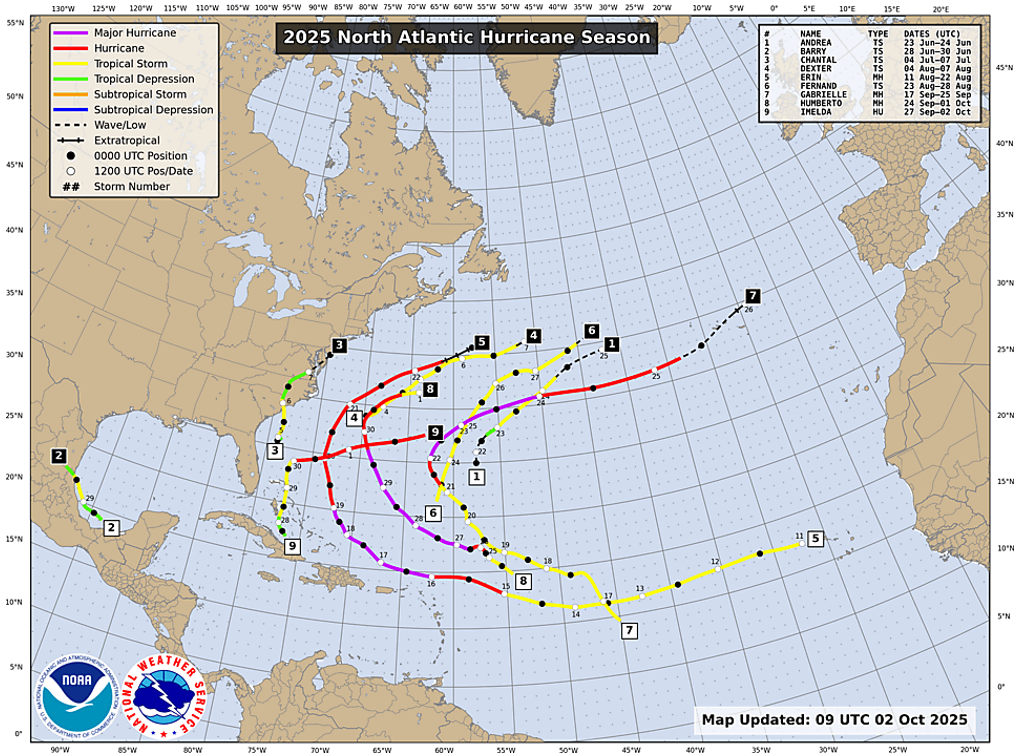
As I write this, hurricane Imelda is speeding away from Bermuda, which will be the only place to have seen a direct hit from the tropical cyclone.
Such has been a fortunate characteristic of this year’s Atlantic hurricane season as of early October 2025. Of the nine named tropical cyclones, only three have made landfall. Imelda was the first to do so at greater than tropical storm intensity.
Result being that despite already featuring three major hurricanes, this season has so far inflicted relatively low damages.
Evidently, those basin-wide totals aren’t a reliable indicator of how impactful a hurricane season will be. Yet for decades, that metric has been the focus for forecasting efforts. There’s good reason behind this, which we’ll get into next, before looking at how MetSwift has developed a commercially viable regional view that’s more closely tied to damages.
The Traditional Basin-Wide View
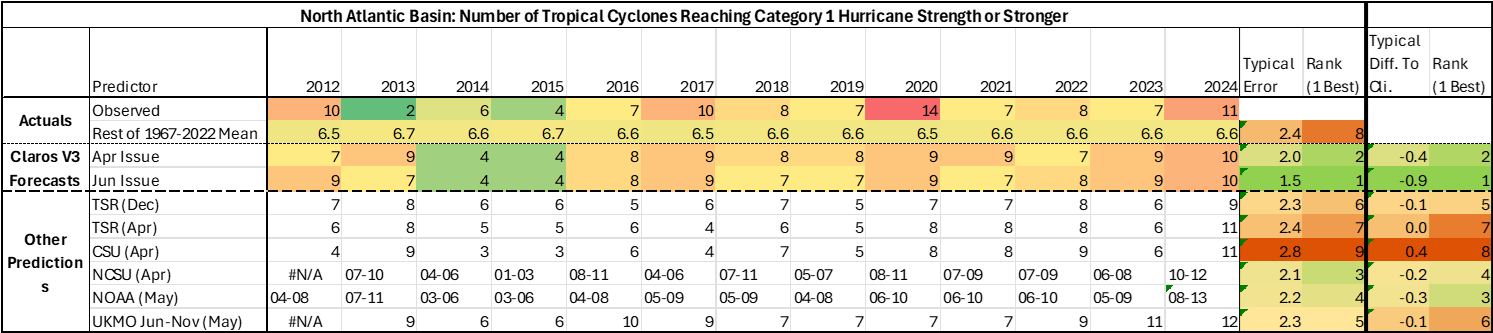
Currently, most Atlantic hurricane season forecasts focus on basin-wide total numbers of tropical storms, hurricanes, and major hurricanes. These values are inherently easier to predict than the detail of where those tropical cyclones will tend to be located. That’s not to say that it’s not a challenge, though. In fact, when making predictions each April for the hurricane counts in each following season of 2012-2024, only MetSwift and NSCU have demonstrated useful skill relative to using a long-term average.
Having useful predictions for the total number of hurricanes can be beneficial for decision making, especially when employed across a decade or more. The advantage is however limited by large variability between seasons with similar hurricane counts. In some seasons with many hurricanes, most of them hit land areas, leading to widespread losses. In others with similarly many, nearly all stay out at sea, leading to minimal losses.
Loose Relationship with Damages
The table below illustrates how ‘loose’ the correlation between basin-wide hurricane counts and estimated damages has been across 2012-2024.

2021 and 2023 both saw 7 hurricanes, yet the estimated damages were over 21 times lower in 2023. While 2021 saw multiple hurricane landfalls including category 4 hurricane Ida (in Louisiana) inflicting over $75 bn in damages, 2023 saw just one hurricane landfall, from a category 3 hurricane Idalia (in Florida), leading to relatively small damages (still substantial for the affected area).
A Functional Solution
To characterise this variability of hurricane distribution, MetSwift has leveraged ‘empirical orthogonal functions’ (EOFs). In short, an EOF is a mathematical technique for representing variance across time within a multi-dimensional space.
Importantly, this variance is categorised into ‘leading modes of variability’, known as ‘principal components’ which means multiple dominant patterns of variance can be captured.
Dominant Modes of Variability in the Spatial Distribution of Hurricanes
In short, it was found that while the total number of hurricanes plays a significant role in the variation between seasons, it’s not the most dominant mode of variability.
Here, we represent it as principal component 2, which is inversely proportional to the number of grid points affected by hurricanes in the season. In the low activity cases (PC2 >= 0.5), the rate at which seasons delivered one or more hurricane hits is never more than 1 in 3. By contrast, in the high activity cases (PC2 <= -0.5), much of the western basin has rates of at least 1 in 2.
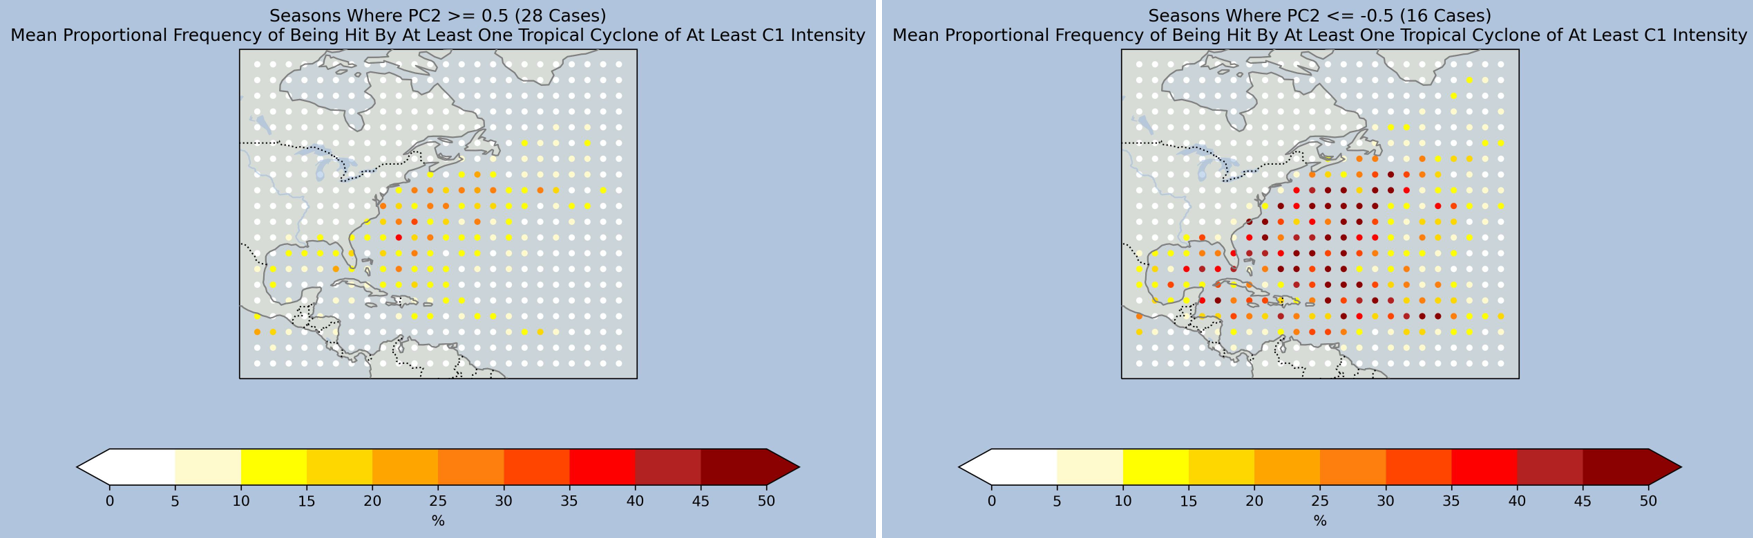
The variation activity across the basin is strongest across the Caribbean Sea and to the east of there. Aside from that, there’s not much association with the distribution of hurricanes, only their general coverage. Not so for what proved to be the greatest mode of variability.
The most dominant mode of variability, represented by principal component 1, is the ratio of hurricane coverage between the western part of the basin and the remainder.
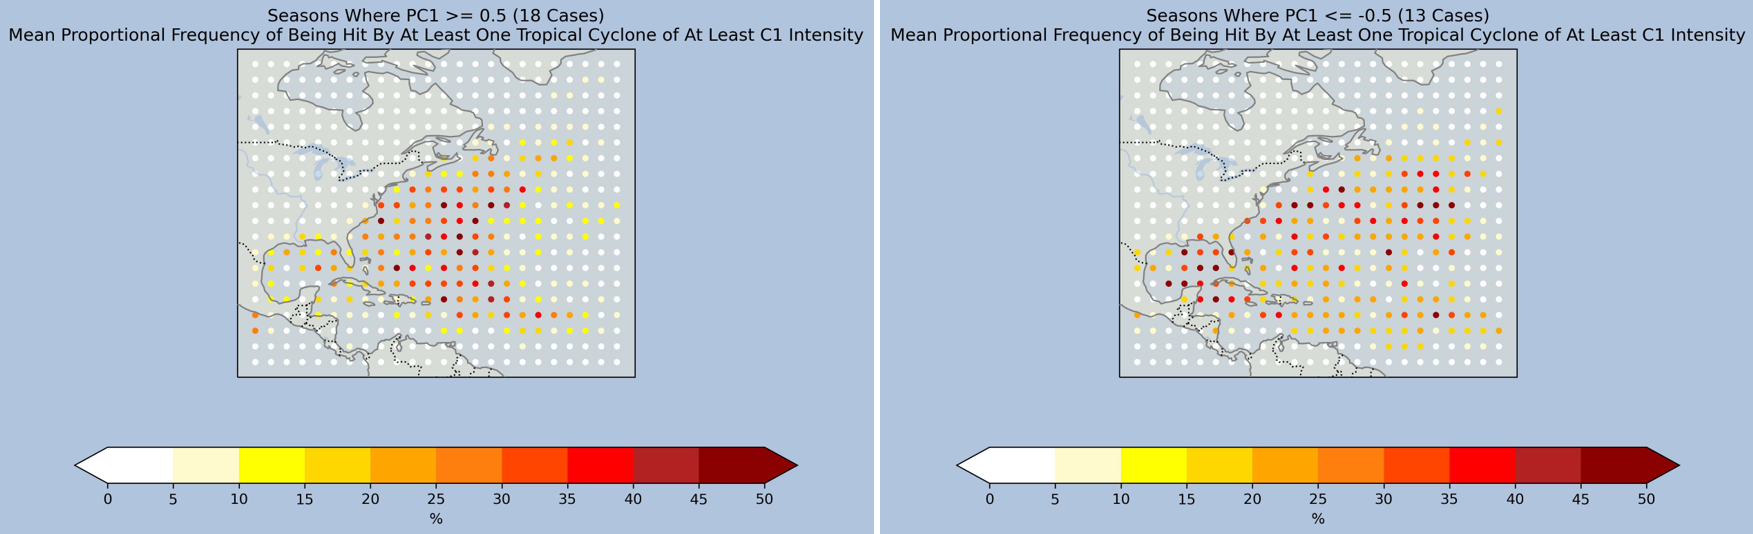
High values represent a concentration of activity in the western basin, with relatively little in other areas, especially the Caribbean. This brings more hurricane landfalls to the East US Coast, and fewer to the Gulf of Mexico and Caribbean regions.
Low values correspond to a more dispersed hurricane distribution, with two focal areas, one in the Gulf of Mexico – north-western Caribbean, the other the subtropical Atlantic. Those two areas see more hurricane landfalls, while the northern half of the East US coast sees fewer.
Regional Scale Hurricane Frequency Prediction
Leveraging the above discoveries, MetSwift has applied the ground-breaking methodology used for Claros V3 to establish how the spatial distribution of hurricanes responds to the behaviour of large-scale phenomena known as teleconnections. They are inherently much slower changing compared to day-to-day weather patterns, which makes them more predictable at long lead times. This in turn increases the predictability of connected weather events like hurricanes. The door has been opened to skilful hurricane frequency prediction on a regional basis.
The regions used are flexible, with three shown below as an example. They have been selected for their association with hurricanes directly impacting land areas (with or without landfall). It’s rare that a tropical cyclone in the Gulf of Mexico or Caribbean dissipates or departs without such impacts. Ones near the US East Coast have more chance of staying clear but still pose more of a threat than ones further out at sea.
MetSwift is actively developing the next version of the predictive model. In the meantime, some results from the current one are shown below.
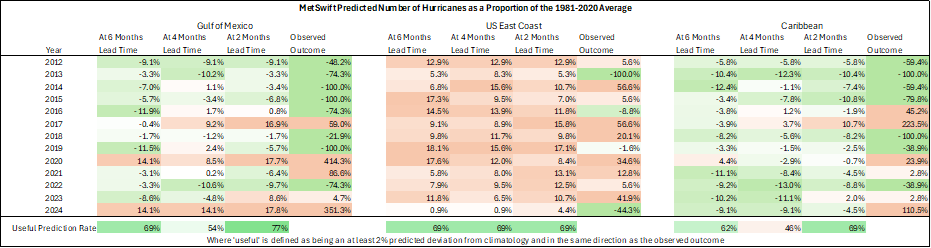
Although some bias is evident, the model’s predictions for the seasons of 2012-2024 are useful around two-thirds of the time. Impressively, this is achieved at 6 months lead time for all three regions. Useful predictions were given for the Gulf of Mexico for over three-quarters of the seasons.
Version two is expected to deliver even better performance – watch this space!
James Peacock MSc
Head Meteorologist at MetSwift
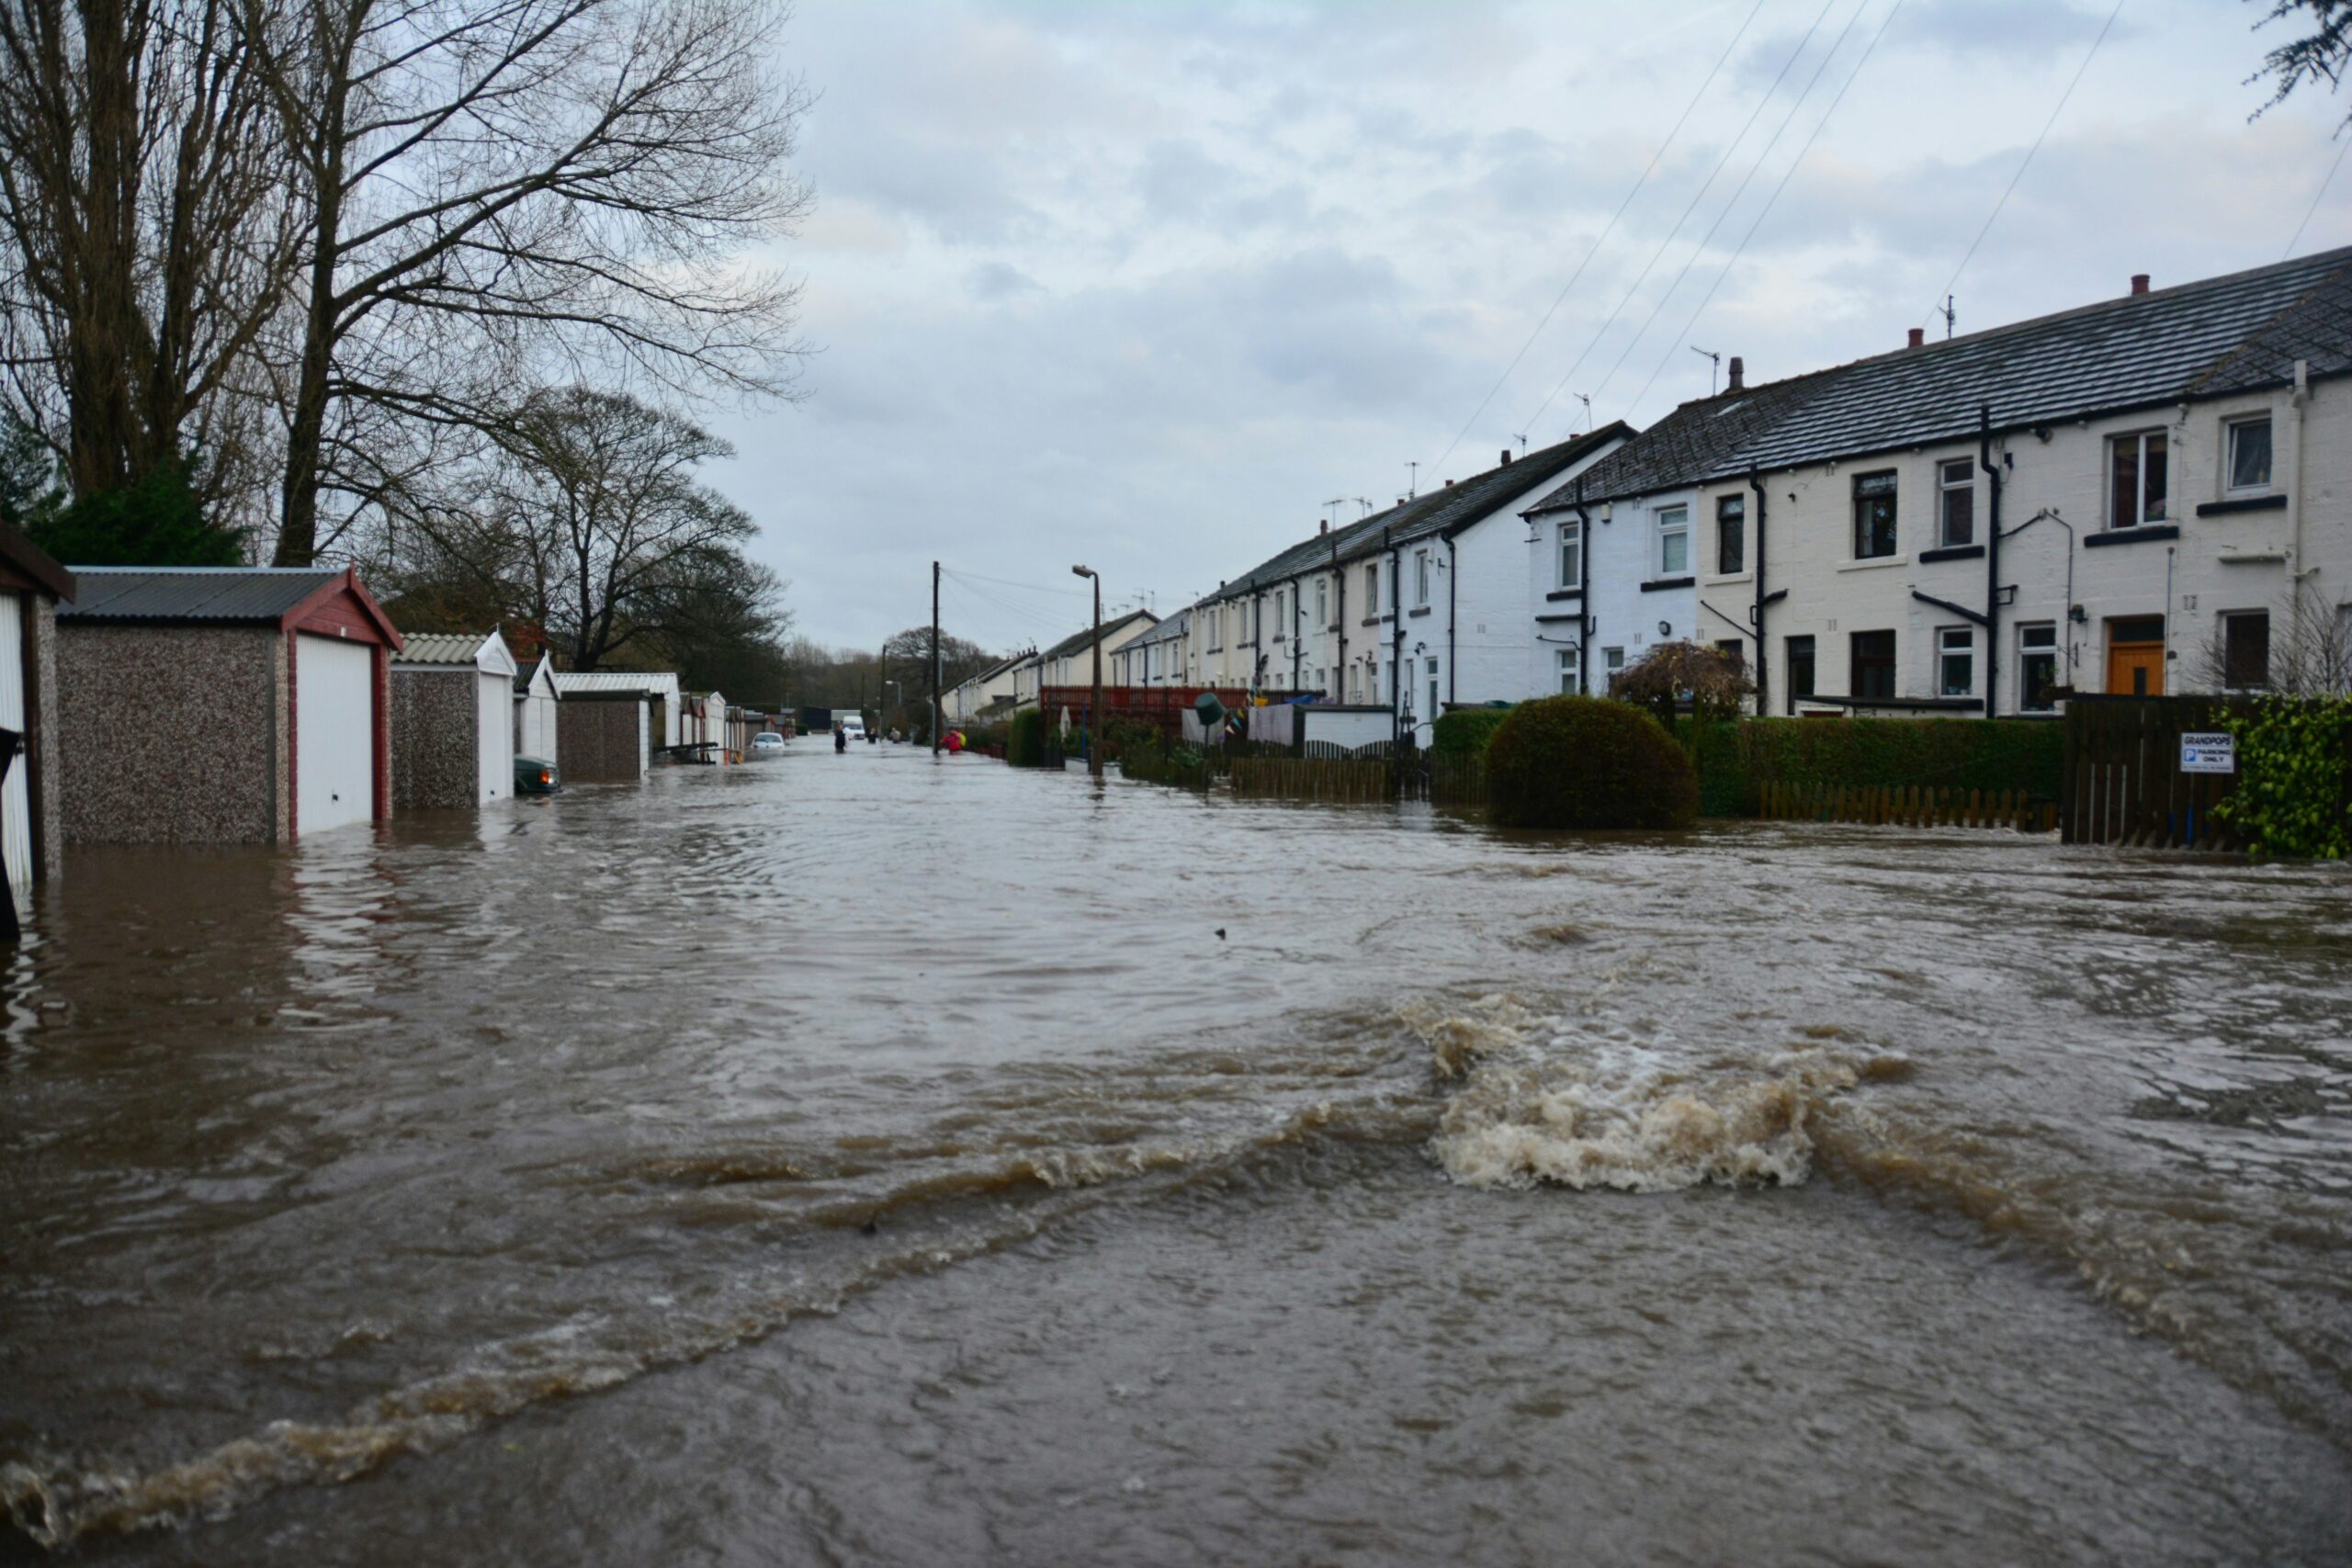
Featured photo by Yevhen Buzuk on Unsplash