Weatherwise, January 2026 has been an eventful month in the mid-latitude northern hemisphere, with considerably cold weather affecting several large areas while copious rainfall deluged others.
Read on for a round-up of what went on, how it came to be, and what may be on the cards as we head toward the spring.
Two-Faced Temperatures
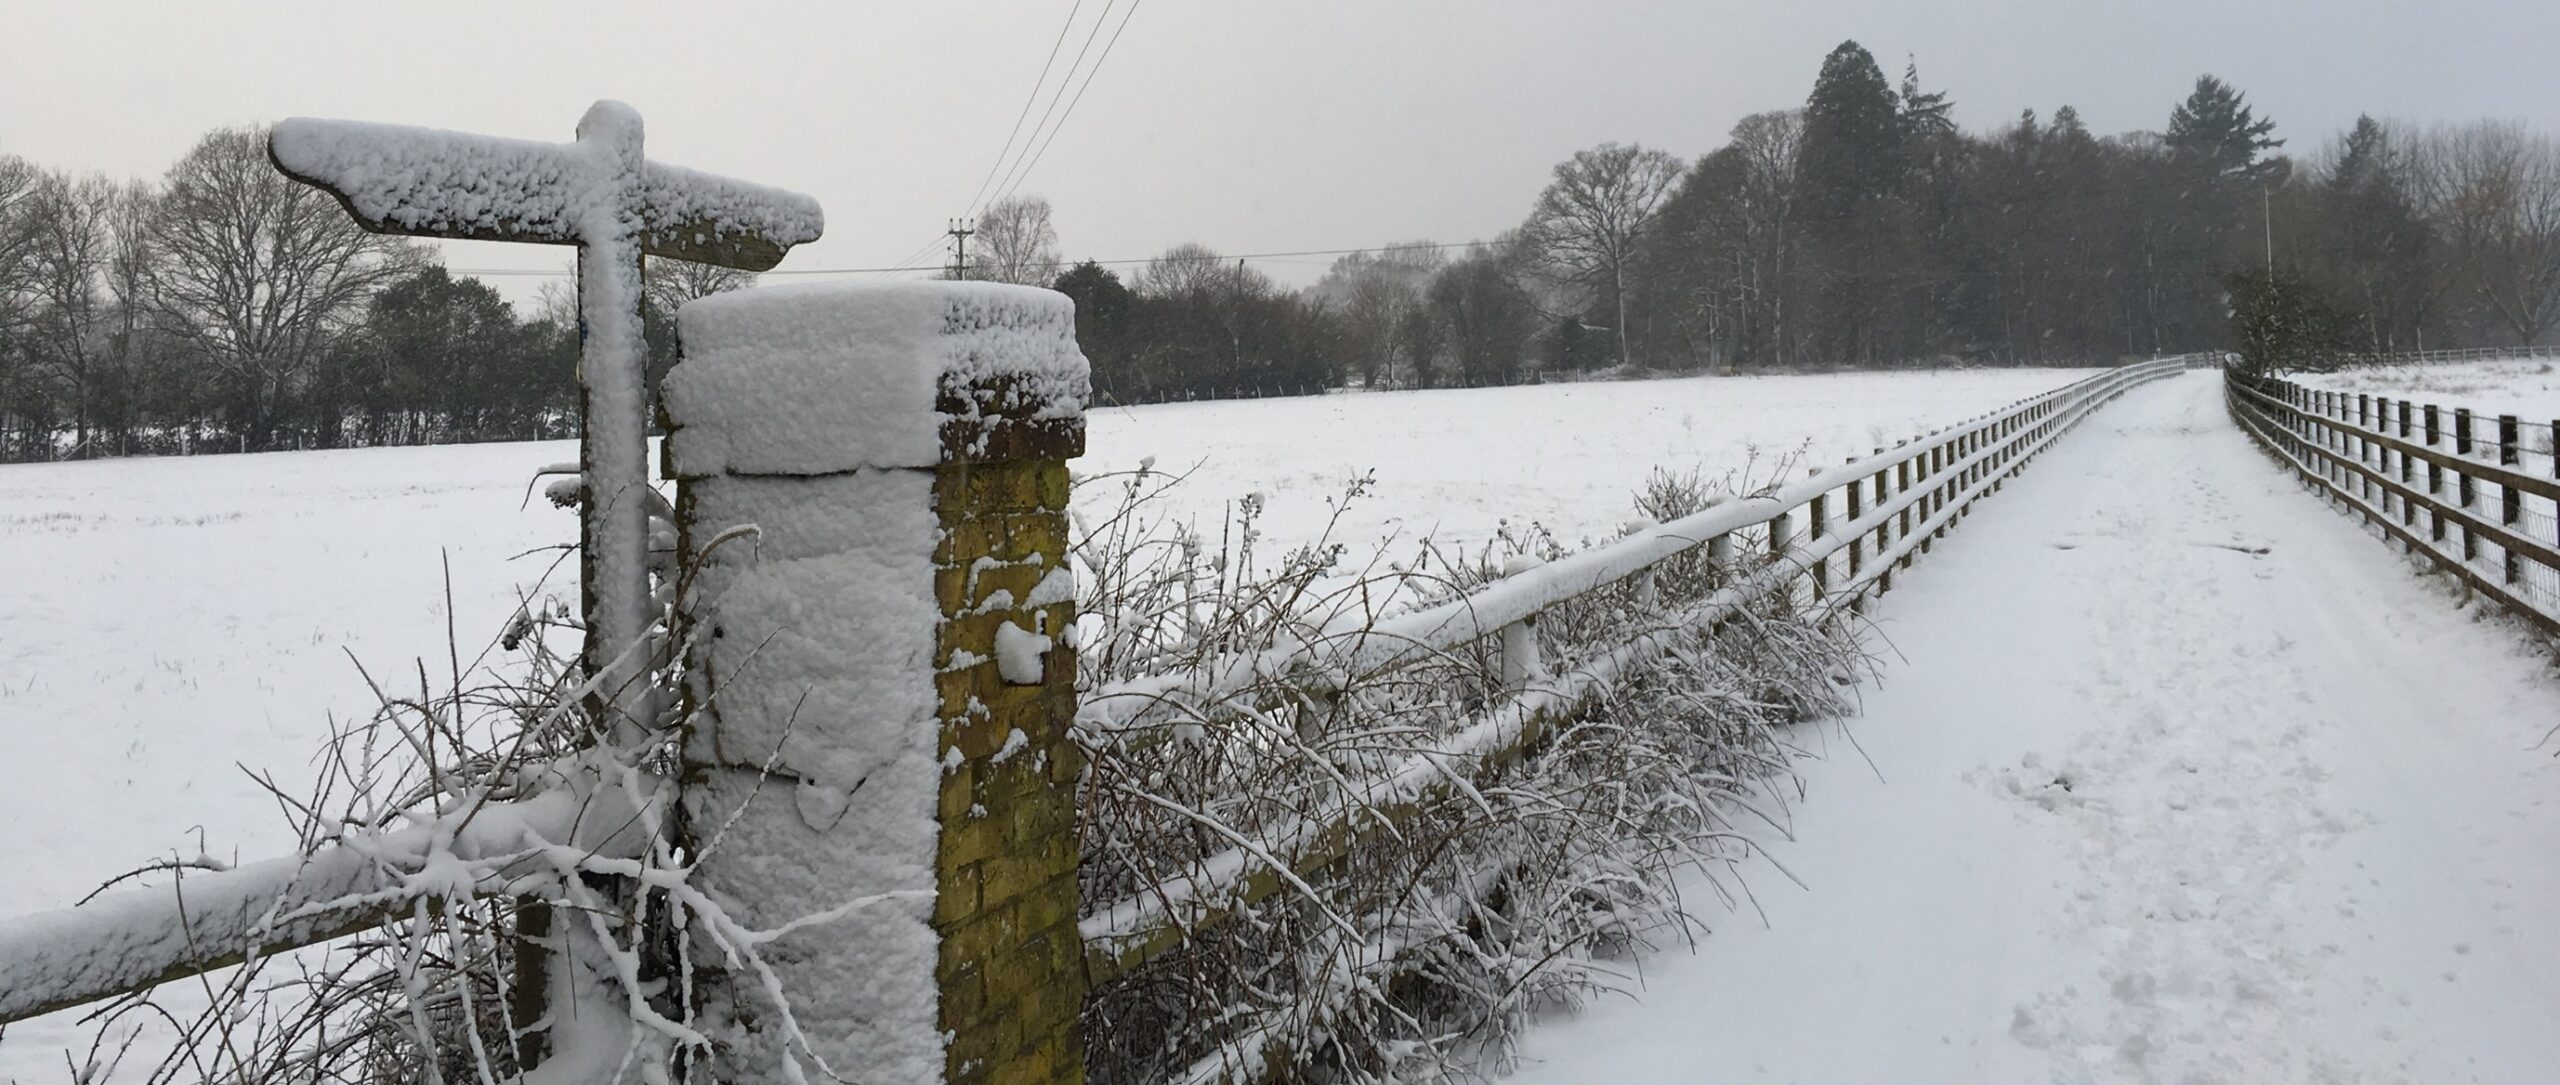
Much of north-eastern Europe through to central-northern Asia has experienced one of the coldest months in decades. There have also been several notable cold weather outbreaks in the north-eastern US, while the tail end of the month saw cold, snowy weather reach all the way to South Carolina.
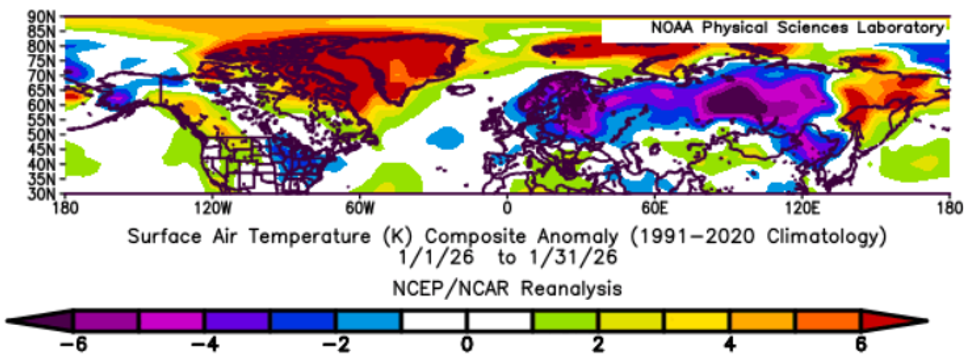
By contrast, much of Arctic Canada & the islands to the north of Scandinavia have been a far less cold month than usual, as have many parts of easternmost northern Asia.
Overall, this fits a ‘warm Arctic, cold continents’ pattern associated with persistent high latitude blocking, which I’ll elaborate on later.
Southern Soaking & Western Deluges for Europe
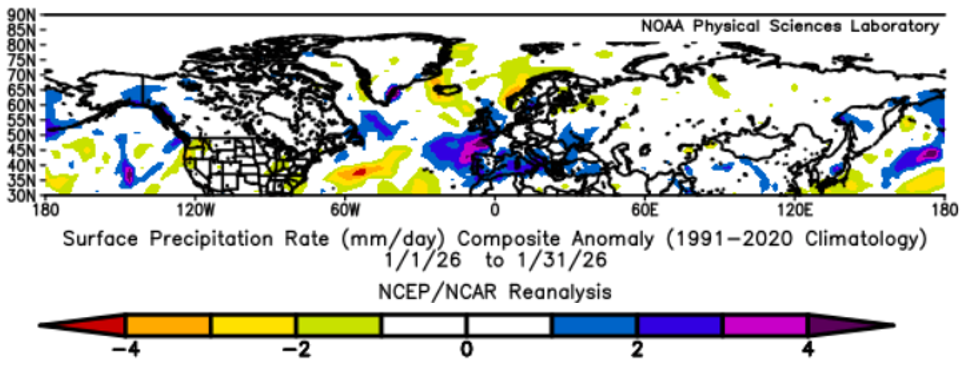
Rainfall wise, the picture is generally more muted but with a glaring exception in Europe. While Iceland and north-western Scotland experienced an unusually dry January, southern and western parts of Europe saw above normal rainfall.
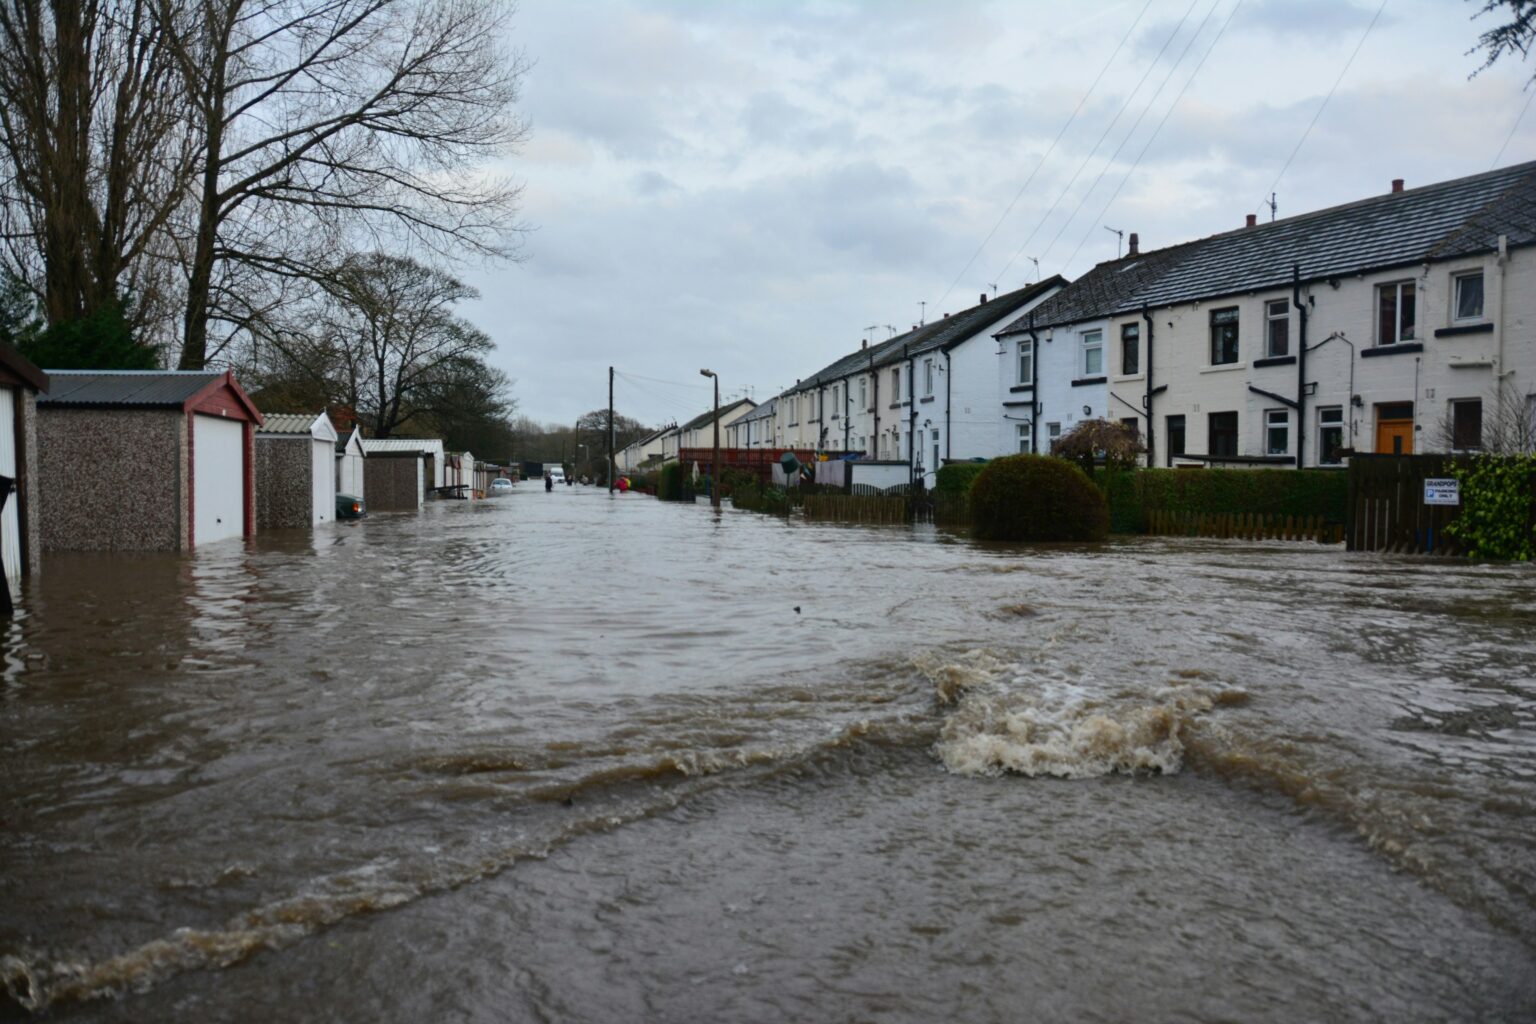
Most of all the area between north-western Portugal and south-western England. It’s been among the wettest Januarys on record there. The Portuguese section has seen the most severe impacts, with extreme rainfall leading to flooding and landslides.
Much of that wet weather has been in association with a serious of vigorous low pressure systems which also brought strong winds. Storm Kristin wreaked havoc on central and northern Portugal in late January, sadly leading to at least 5 deaths.
Blame High-Latitude Blocking
As mentioned earlier, the weather patterns fit the template of ‘high-latitude blocking’. It’s characterised by slow-moving high pressure areas occurring at latitudes within about 40 degrees of the pole.
In January 2026, this occurred primarily between Greenland and the Beaufort Sea. Importantly, those blocking highs then circulate very cold air from the Arctic into the mid-latitudes. This follows a clockwise motion in the northern hemisphere, typically resulting in cold easterly winds in northern Europe for example.
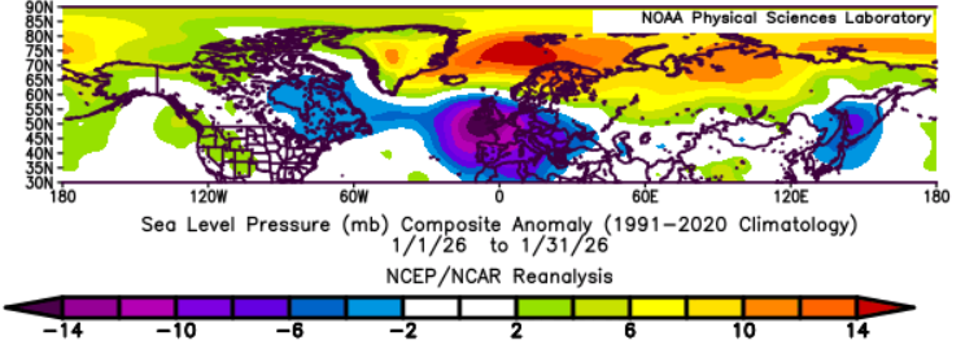
While such blocking highs are in place, low pressure systems track further south than usual. This has been extremely evident across Europe in recent weeks, hence the copious rainfall in southern and western parts.
An Oddity for North-Western Europe
Unusually for this pattern, the blocking highs rarely extended across north-western Europe. I believe this was in part due to a stratospheric wave reflection event (an example of which is outlined in my November blog) in mid-late January. It likely played a role in moving cold air south-eastward across the US and then the central North Atlantic, which then interacted with warmer air further south and east to bring about strong cyclogenesis events. Some of the resulting lows were exceptionally deep for how far south they travelled.
The stronger westerlies and deeper lows were able to advance across north-western Europe at a time when we’d usually expect a cold, either dry or snowy run of weather to establish. In the end, only Scotland has experienced much of that within the region.
Winds of Woe
The zonal wind anomaly is a good way to visualise the effect of high latitude blocking on the movement of airmasses. In meteorology, a positive zonal wind refers to west-east movement of air, and vice versa. When viewing anomalies, positive equates to more west-east movement than usual, and negative less.
In January 2026, the near-surface zonal wind was anomalously positive from the Mediterranean westward to the eastern US, especially around the Azores. So, there was much more transport of moisture laden air from the Atlantic into southern Europe than usual.
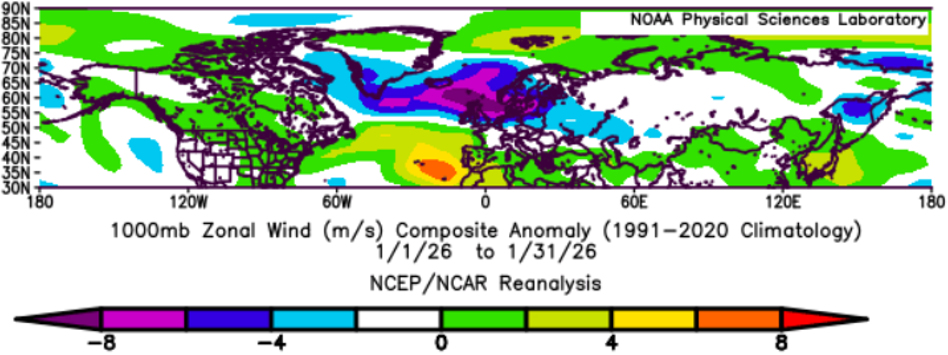
Some of that moisture was then moved northward to traverse north-western Europe. Unfortunately for the UK & Ireland, this moved it into an area of much reduced zonal wind, causing weather fronts to become slow-moving overhead.
Origins of the High-Latitude Blocking
Much of what has taken place so far this winter may be explained by interactions between events in the troposphere (layer of atmosphere in which we live) and the stratosphere above it.
Late autumn into winter, strong tropical thunderstorms occurred over the equatorial Pacific. They triggered energy transfers, some of them poleward and then upward into the stratosphere. Some of that energy was absorbed into what’s known as the polar vortex, an anticlockwise circulation that exists throughout the stratosphere between early to mid-Autumn and sometime in spring.
A good way to monitor the polar vortex is the northern annular mode (NAM) index. Especially if you take a vertical cross-section of the atmosphere from the surface to the upper stratosphere. That’s exactly what’s been done in the chart shown below.
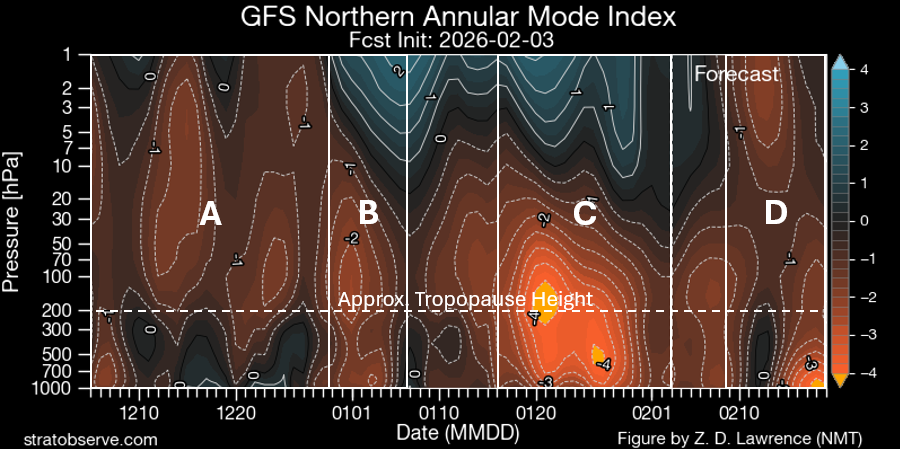
When and where the NAM index is positive (blue shading), the polar vortex is in a strong state. When and where negative (orange shading), it’s in a weak state.
We can see that the late autumn into winter energy transfers led to the polar vortex being in a weak state throughout much of the stratosphere during December (box A). However, aside from briefly early on, this was not true in the troposphere (below the tropopause).
As a result, that month featured high-latitude blocking highs only intermittently and less extensively than in January. Most of it was in the final third of the month, during which low pressure began visiting south-western Europe. You can check out the monthly mean sea-level pressure anomalies here.
Early January: Stratosphere to Troposphere Coupling?
As the new year got underway, a significant change took place in the atmosphere above the Arctic. It appears that the weak polar vortex state in the lower stratosphere ‘coupled’ with the troposphere (box B). The tropospheric NAM, also known as the Arctic Oscillation (AO), turned negative. In that state, high-latitude blocking becomes much more likely. Sure enough, that’s what manifested, initially in the vicinity of Iceland. This brought a cold opening third of January to northern and western Europe.
There is some debate over whether the stratosphere alone forced this initial blocking pattern. In the troposphere, a modest cycling of atmospheric angular momentum (a subject for another day…) may have played a role, with the stratosphere assisting.
Mid-January through Early February: Tropical Supercharge
Just over a week into January, strong thunderstorms returned to the equatorial Pacific. Resulting energy transfers effectively supercharged the -NAM state in the troposphere and lower stratosphere for the second half of the month (box C).
No coincidence that high-latitude blocking became more extensive, with some more extreme weather events hitting Europe and North America.
What’s Next?
The -NAM state in the lower atmosphere weakened to end January. Signs are, it will remain weakly negative until about 10th February. Beyond then, the picture becomes highly uncertain. A sudden stratospheric warming (SSW) event is forecast, but it’s unclear how strong that will be.
It could be strong enough that the resulting -NAM in the upper stratosphere is able to propagate down through the lower stratosphere (box D), to affect the troposphere during late winter into spring. That would encourage high latitude blocking patterns, making for a fitful, perhaps drawn-out transition into warmer spring weather for areas like Europe and the US.
Or it could lack the strength to do that, with the lower atmosphere driven more by events within rather than above. In that scenario, a more varied second half of February is likely for Europe and the US. Some tastes of spring interspersed with throwbacks to winter.
Complicating this picture even further, strong tropical thunderstorm activity is now emerging over the Indian Ocean. Some forecasts sustain this for long enough that it would begin to encourage high latitude blocking patterns by the third week of February. Who said forecasting was easy?
Personally, I suspect it won’t be a smooth transition into spring warmth this year for Europe especially. As ever, I’ll be keeping track on this and sharing thoughts on social media.
James Peacock
Head Meteorologist at MetSwift
Featured photo by Chris Gallagher on Unsplash