This builds upon a shorter post I published back in August 2024, to further explore the connection between ‘specific’ and ‘relative humidity’, and how the combined effect of relative humidity and temperature can be represented using the ‘heat index’.
An Escalating Status
Across the world, air temperatures have been trending upward since the mid-20th century.
Shorter-term weather patterns continue to bring colder months, and not every year is warmer than the last, but if you look at a span of 50+ years, you’ll find that more recent years have tended to be warmer.
Contrary to the claims of few, this has been widely established using unadjusted observations from reliable weather stations. For near-surface air temperatures (2 m elevation), the evidence is plain to see on Prof. Ed Hawkins’ excellent ‘Show Your Stripes’ website.
As a result, we’re experiencing a warmer-feeling world. This can be to our net benefit or detriment depending on the time of year and where we are in the world.
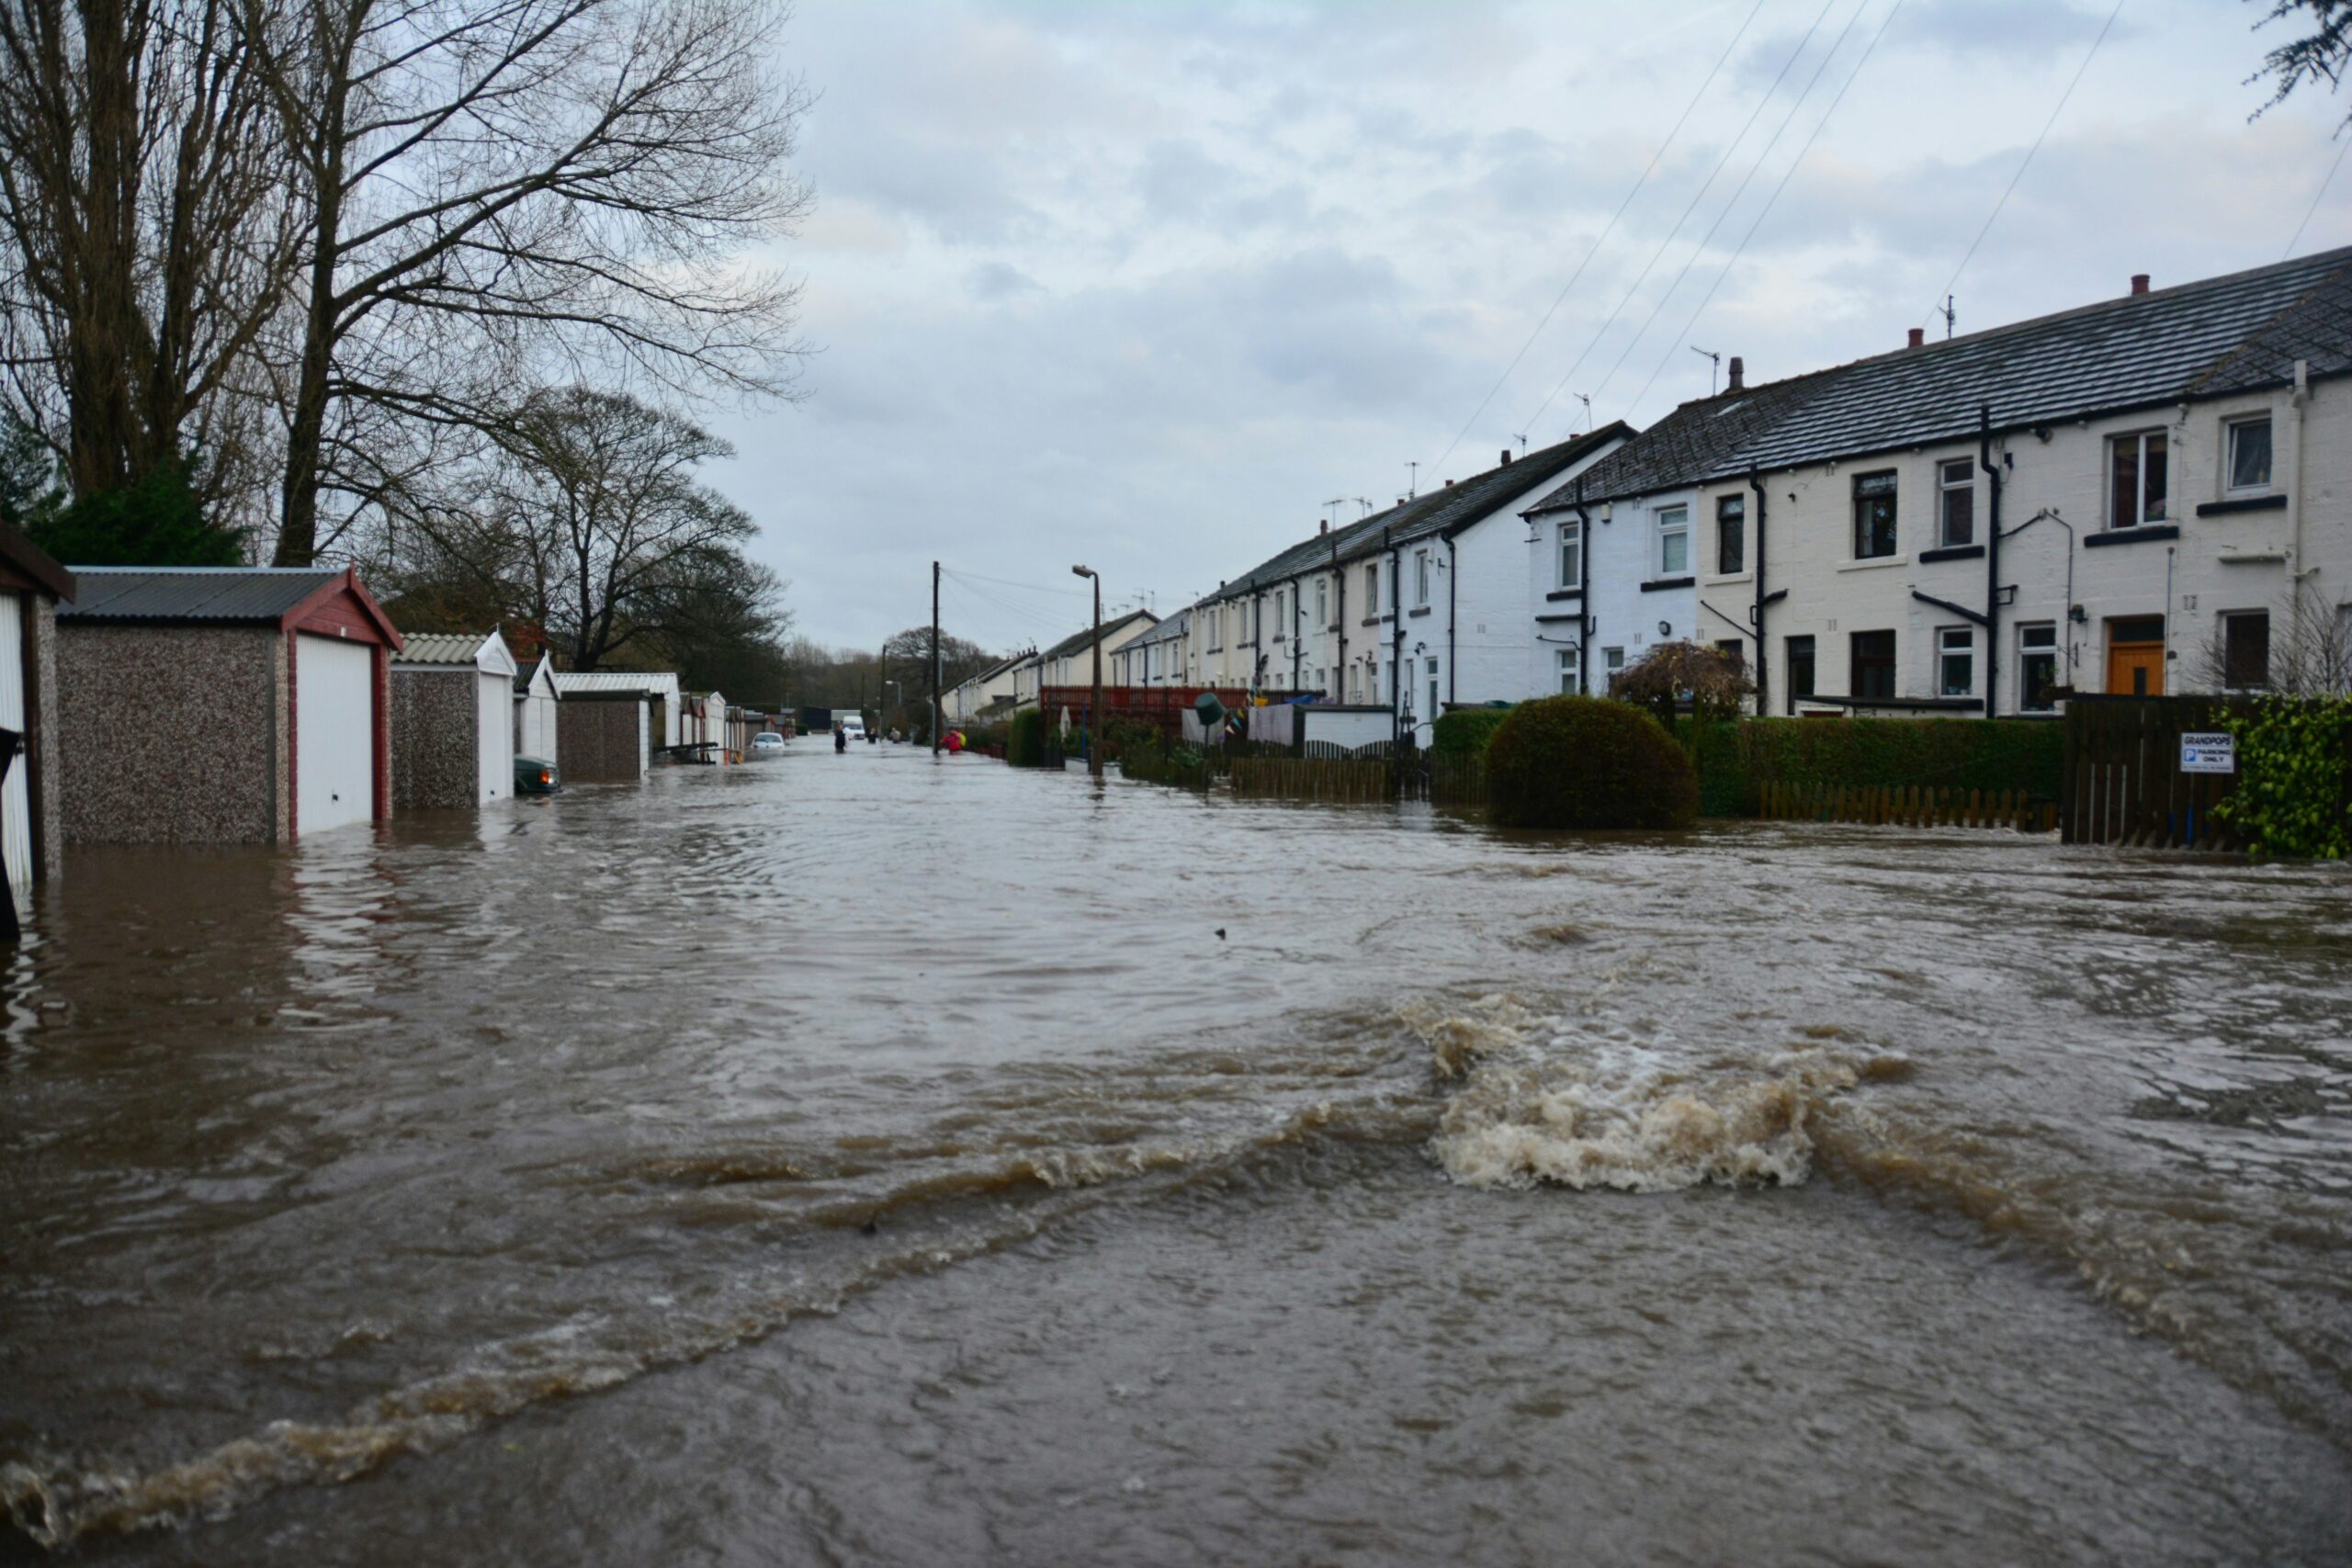
Unfortunately, it’s not just a warmer world, but a sweatier one. While this tends to be of little consequence in cool or cold weather, it can make a substantial difference to quality of life when it’s warm or hot.
Unhelpful Humidity
Earth’s atmosphere can ‘hold’ water vapour. If that wasn’t the case, we’d never see any clouds or rainfall, and life on land would look very different.
For a given quantity of air, humidity refers to how much water vapour is contained within. Importantly, there’s a limit to this, a point at which the air has no ‘room’ for more water vapour. This is known as the ‘saturation point’.
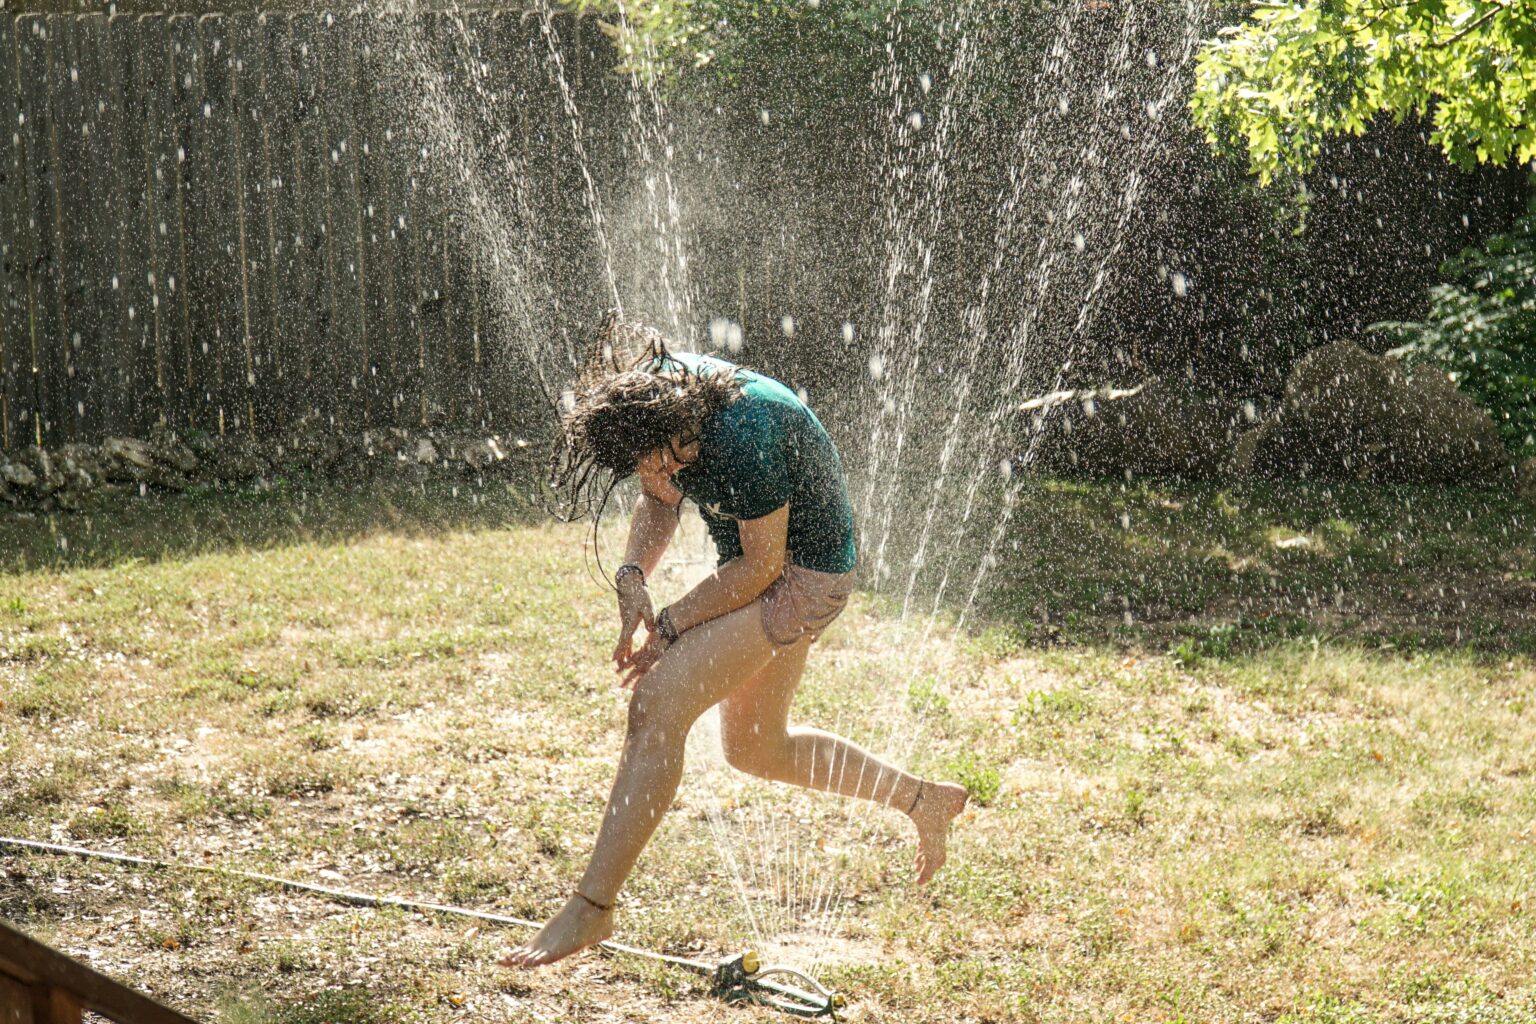
When it comes to staying cool in hot weather, we humans rely heavily on evaporation of sweat from our skin, which transports heat away from our bodies. This makes the saturation point very important to us, because the closer to that point the air is, the more slowly our sweat evaporates.
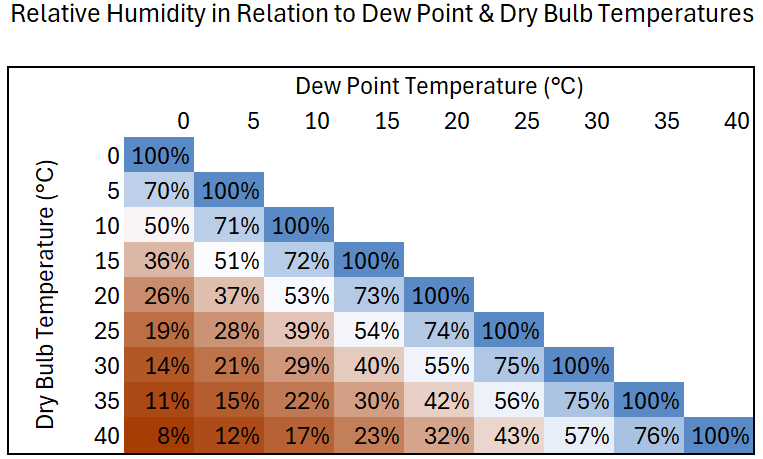
Handily, how close to saturation the air is can be represented as ‘relative humidity’, simply a percentage that ranges from 0% for totally dry air to 100% for saturated air. The table below demonstrates this for a range of values.
As per the example below using a weather station in Hampshire, England, relative humidity is typically highest overnight and lowest in the afternoon.
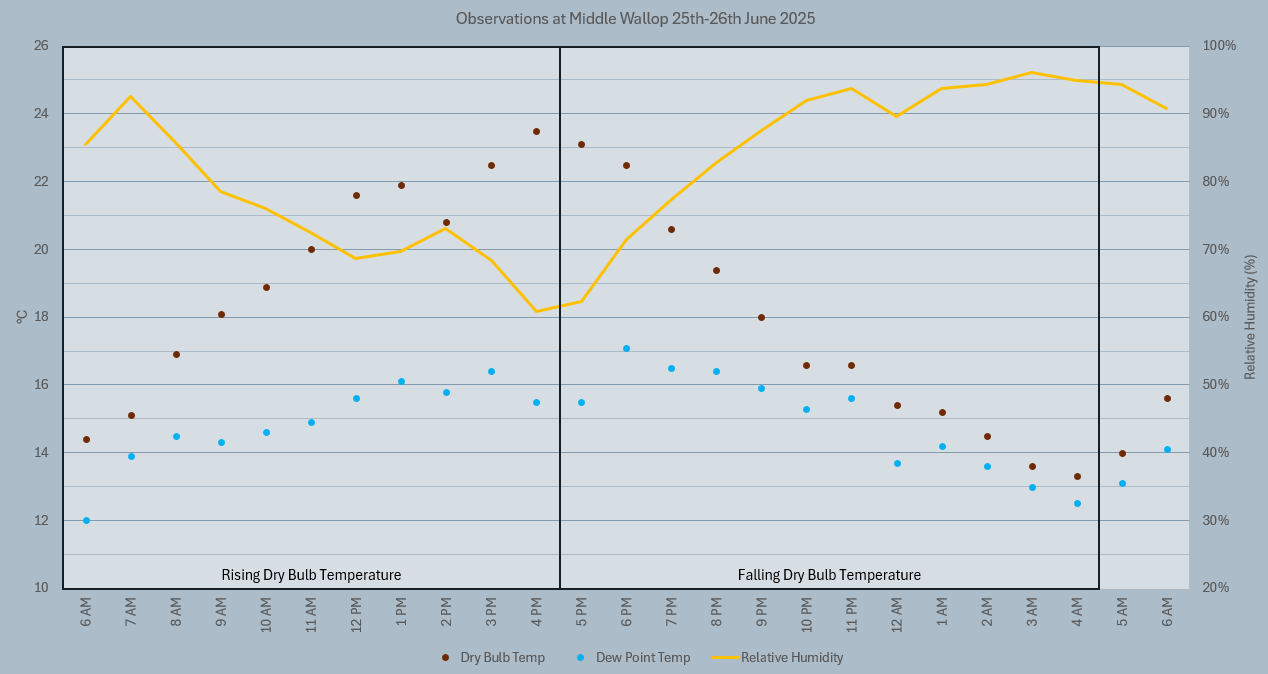
This is because on a typical day, the rise in air temperature driven by sunlight is too large for the supply of moisture from evaporation and transpiration (from plants) to compensate for.
Of course, this daily cycle is much more muted, or absent, when the weather is very cloudy or sunlight weak. Away from the tropics, it tends to be at its strongest late spring through late summer. That’s why during hot weather, despite having higher air temperatures, the afternoons tend to be more comfortable than the evenings.
The effect of relative humidity on how hot the weather feels can be well approximated using a measure called the ‘heat index’ (or ‘humidex’, used widely in Canada).
‘Heat Index’: A ‘Feels-Like’ Temperature
The table below shows how this measure varies with the dew point and dry bulb temperatures. Notice how it can be lower than the air temperature whenever the air is very dry (dew point well below dry bulb) or the air temperature is freezing or close to it (that ‘damp chill’ effect).
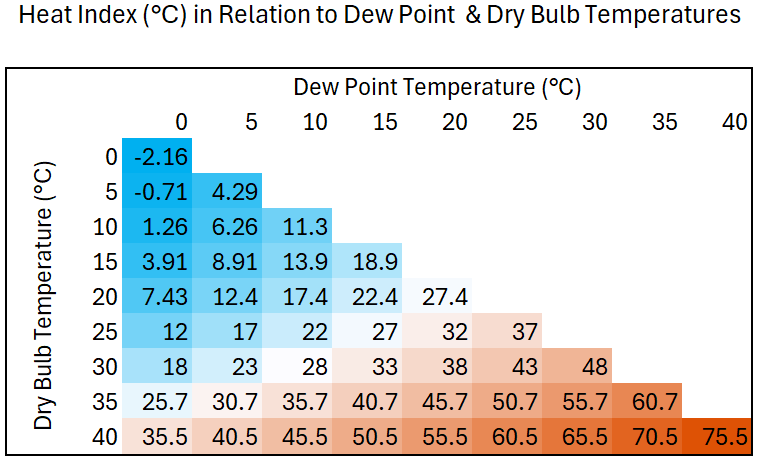
For this blog we’re more interested in the other end of the spectrum. Get an air temperature in the low 30s °C with a dew point in the low 20s °C and it can feel like the high 30s to low 40s °C. In more extreme cases, the heat index can exceed 60°C!
The highest dew point on record stands at 35°C at Dhahran, Saudi Arabia, 3 pm 8th July 2003. It was accompanied by a dry bulb reading of 42.2°C, which equates to a staggering heat index of 75.6°C. While only estimating how the weather felt, it’s unsettling that conditions even close to that are possible anywhere on Earth.
The graphs below show how the heat index varies with relative humidity at a constant air temperature (a.k.a. ‘dry bulb temperature’), and with air temperature at a constant relative humidity.
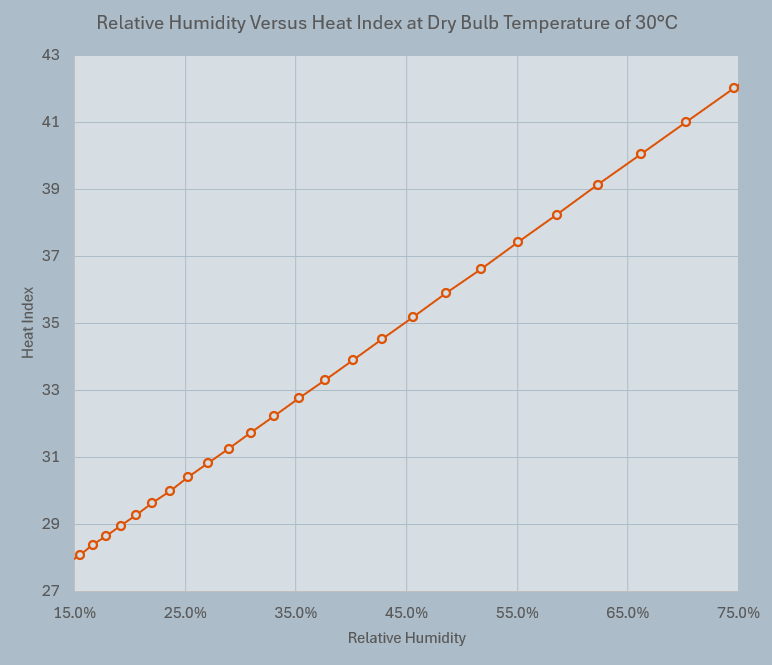
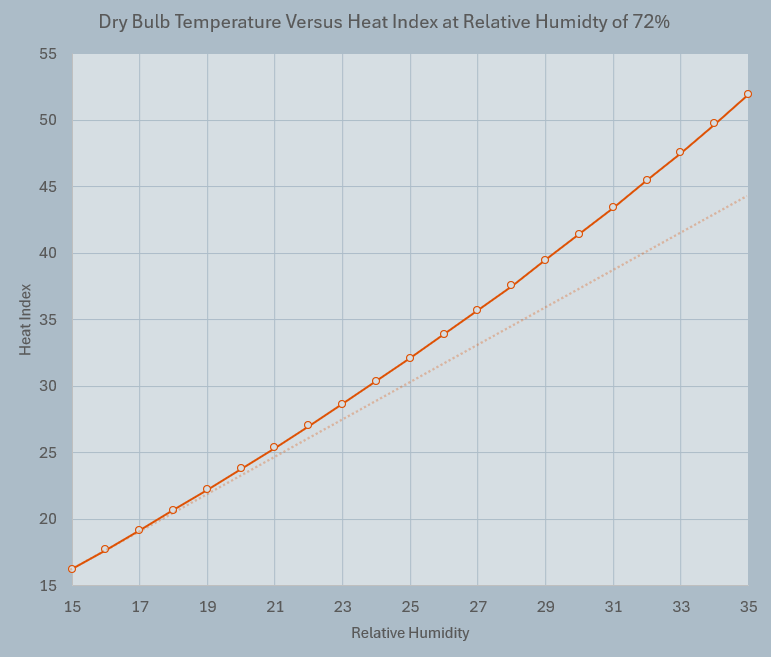
Notice the simple linear relationship with relative humidity, but nonlinear with air temperature. This has an extremely important implication: As the climate warms, relative humidity must drop to preserve our ability to cool down by sweating.
So, what’s it doing? Well, the short answer is it’s dropping, but not by enough to neutralise the effect of increasing air temperature. The long answer is a little complex, but if feeling up to it, let’s dive in.
Higher Yet Relatively Lower
The behaviour of relative humidity with climate change comes down to a race between air temperature and influx of moisture from water bodies, ground stores, and living organisms.
Warmer seas and soils, and organisms trying to stay cool, are supplying larger amounts of moisture to the air via evaporation, transpiration (from plants), and panting or sweating. The first two contribute the most.
Meanwhile, the warmer air has a larger capacity for suspended water vapour. For a static dew point, every 1°C increase in air temperature drops relative humidity by approx. 6 to 6.5%.
This begs the question: Is the dew point increasing (due to more moisture influx) fast enough counter that?
The answer could be summed up as ‘no, but…’.
Averaged across the world, the temperature has been winning the race since the 21st century began. This is evident in a series of graphs published by the Met Office using a Hadley dataset called ISDH.
In those, the amount of moisture in the air is represented by the specific humidity (and a related measure, dew point). We can see that it’s been trending upward since at least the mid-1970s. Yet since 2000, the relative humidity overland (green line) has been decreasing.
But there’s a problem: How hot the weather feels is more sensitive to the air temperature than the relative humidity. This means that to offset the effect of more moisture influx, relative humidity must not only decrease but do so sufficiently fast.
Unfortunately, in many parts of the world, it isn’t.
Faster Increase in How Hot it Feels
To demonstrate this, here’s a look at summer (JJA) mean temperatures, dew point, relative humidity, and heat index, averaged across UK and Ireland, 1951-2023.
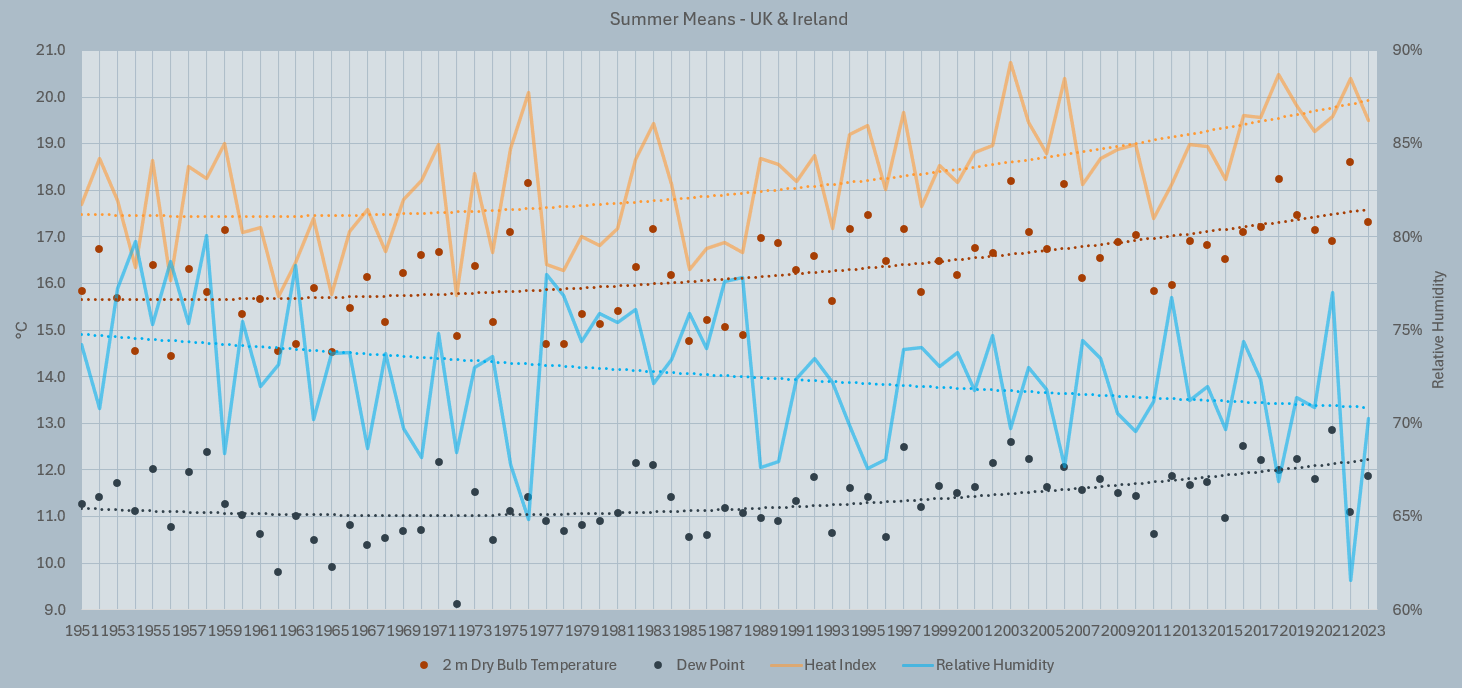
We can see upward trends in air temperature (‘dry bulb temperature’) and moisture content (via ‘dew point’). Meanwhile, there’s a downward trend in relative humidity.
But what really matters here the heat index, which is very much trending upward. Since the 1980s it has been slightly larger than that of air temperature. This tells us that the increase in temperature is affecting the heat index more than the decrease in relative humidity.
How hot the weather feels is increasing faster than temperatures alone would suggest.
Crucially, this isn’t just a matter of opinion. It equates to an increase in heat stress among people and animals alike. Especially species like us which rely on sweat for natural cooling.
So it is that where summers are hot, demand for air conditioning is increasing. However, this comes at a cost that not everyone can afford. Those which can’t are faced with hotter homes that offer less respite from the heat, if any at all. Breaks from the heat are essential for avoiding heat stress, a condition that reads to reduced productivity, poorer health and in extreme cases, loss of life.
Is There Any Upside?
This question has a two-faced answer. Stepping back from the hot season and considering the entire year and at the global scale, there is evidence that so far, a warming climate has led to a larger net reduction in winter deaths compared to the increase in summer deaths. Historically, severe winter cold spells have tended to be more deadly than severe summer heatwaves.
However, there are studies which predict that with continued climate warming, in at least some parts of the world (e.g. Europe), the rise in heat related deaths will begin to outpace the drop in winter deaths. Before long, the net change in fatalities relating to climate warming heads above zero. This 2021 study estimated, at the 95% confidence level, a 0.4 to 1.9% increase in heat-related global mean mortality rate by 2100.
It would also be remiss to overlook the tropics, where hot conditions are nearly constant and generally accompanied by high relative humidity. There, the effect of climate warming is amplified and can only increase the mortality rate.
Evidently, it’s hard to talk about climate change in a positive manner when looking at the wider picture. There will always be ‘winners and losers’ – some countries and regions benefit at the expense of others – but the overwhelming evidence is that overall, it’s a negative for life on Earth as we know it.
Yet I can find one upside: We’re not completely ‘locked in’ yet. A great many communities across the world have taken strides to drop long-standing habits in favour of ones that we know will restrain future climate change. It may well be damage limitation rather than avoidance, but it’s worth doing all the same.
James Peacock MSc
Head Meteorologist at MetSwift
Featured photo by Thomas Park on Unsplash